# GoalPath
> GoalPath is a delivery operating system for software teams. It turns your team's execution into automatic progress reports, data-driven forecasts, and visual roadmaps — so stakeholders stay aligned without status meetings.
GoalPath replaces the Friday status email, the Monday alignment meeting, and the wiki that explains how your process works. Teams work in their existing issue tracker (Jira, Linear, etc.) while GoalPath handles the reporting and forecasting layer.
Key capabilities:
- Automated weekly progress reports generated from actual work (available in 8 languages)
- Velocity-based delivery forecasts with best case, expected, and risk-adjusted dates
- Visual roadmap with dependency flow, critical path, and goal tracking
- Goal Path Planning: start with outcomes, work backwards, distinguish commitments from explorations
Built for teams of 5-20 engineers where stakeholders need visibility without heavyweight process.
---
## Documentation
### Getting Started
#### Introduction
# Welcome to GoalPath
You know you need GoalPath when:
- Your stakeholder asks "where are we on this?" for the 5th time this week
- You spend Friday afternoon writing the same status update you wrote last Friday
- Your roadmap is outdated by Monday morning
- Your team groans when you schedule another "quick alignment meeting"
**GoalPath exists to make keeping stakeholders informed automatic, not a part-time job,** because progress should be shared, not interpreted.
## What GoalPath Does
GoalPath is a complete development process that guides you from planning to delivery. No documentation required.
**The core value:** Process built into the interface. Not separate documentation.
Traditional tools are blank canvases. You have to:
- Document your process separately (Confluence/Notion)
- Train everyone on "how we use this tool"
- Manually enforce the process
- Keep documentation updated (never happens)
**GoalPath embeds lean delivery expertise directly in the product:**
- **The interface guides execution and prioritization** - shows you what to work on next and why
- **Planning and forecasting happen automatically** - based on your team's actual velocity and dependencies
- **Progress updates are generated from real work** - stakeholders see shared reality, not manual reports
**Result:** No training docs. No "how we work" wiki. No consultants. Just open GoalPath and follow the interface.
### How This Shows Up
**1. Automatic Progress Reports (Zero-Effort Alignment)**
Every week, stakeholders get plain-English progress reports showing:
- **What shipped** - Completed work with context they can understand
- **What's blocked** - Active blockers flagged automatically
- **Forecast changes** - "Launch moved 3 days → now Feb 14"
- **What needs attention** - Risk-adjusted delivery dates with confidence ranges
**Time to create:** 0 minutes. It's generated from your actual work.
This is not reporting. It's shared reality. [Learn more about Automated Progress Reports →](/docs/features/automated-weekly-updates)
**2. Data-Driven Forecasts (Not Guesses)**
Instead of asking "when will this be done?", you see:
- **3-point estimates**: Best case, expected, risk-adjusted completion dates
- **Confidence-aware**: High, Medium, or Low confidence shapes uncertainty buffers (the less certain the work, the wider the range)
- **Based on actual velocity**: Your team's real delivery speed, not aspirational goals
- **Dependency-aware**: Forecasts account for what's blocking what
Forecasts update automatically as work completes. No spreadsheet math. No guessing.
### 3. Dependency Visualization (Roadmaps as Navigation Tools)
Traditional roadmaps are wishful timelines. GoalPath roadmaps show the critical path, bottlenecks, and execution order.
**Result:** Roadmaps become navigation tools, not decorative timelines. Everyone sees the same path forward.
**The "Aha" Moment**: When keeping stakeholders informed becomes automatic instead of manual, you reclaim 3-5 hours per week. Your team ships. Your stakeholders stay informed. Zero meetings required.
As a result, you stop being a process enforcer and get back to building.
## How GoalPath Works
### 1. Your Team Works
Create milestones, break down work, track progress. GoalPath guides you through lean delivery practices. No separate documentation needed.
### 2. GoalPath Does the Process Work
**Progress reports generate automatically** every week, showing:
- What was delivered
- Active blockers (only if significant)
- Forecast changes and upcoming milestones
- One actionable insight per deliverable
**Generated automatically every Sunday night, ready Monday morning.** Zero work required from you.
### 3. Stakeholders Receive Alignment
Leadership gets:
- Signal over noise (one update per project, per week)
- Data-driven forecasts (not "on track" status dots)
- Evidence-based decisions (grounded in velocity, not spin)
Your team gets:
- No status report homework
- Blockers reach leadership automatically
- Focus on building, not explaining
### 4. Forecasts Update Automatically
As work completes, velocity is recalculated and forecasts update for all milestones. Dependency chains are re-evaluated. The next report reflects the new reality.
No manual updates. No spreadsheet formulas. Just work and let GoalPath do the rest.
## The Business Impact
**Replace 3-5 hours of status meetings per week** with one automated update that takes 0 minutes to create.
## What You Stop Doing
When you switch to GoalPath:
**Stop:**
- Weekly status meetings
- Friday afternoon status emails
- Roadmap spreadsheets outdated by Monday
- Training docs nobody reads
- "Where are we?" Slack messages
**Start Getting:**
- Automatic progress reports (0 min to create)
- Real-time forecast updates
- Plain-English updates for stakeholders
- Process built into the interface
- Early warning on blockers
## Next Steps
- [Quick Start Guide](/docs/getting-started/quick-start) - Set up your first project
- [Automated Progress Reports](/docs/features/automated-weekly-updates) - Deep dive on the killer feature
- [Understanding Forecasts](/docs/features/velocity-tracking) - How velocity and forecasting work
- [Visual Roadmap](/docs/features/visual-roadmap) - Master dependency planning
## Common Questions
**"Do I need to understand Agile or Lean?"**
No. GoalPath embeds the methodology so you don't have to. The interface guides you through the right workflow.
**"What if we don't use story points?"**
Progress reports work perfectly with item completion tracking. Forecasts use story points for velocity when available, but reports work without them.
**"Does this replace all status communication?"**
No, but it eliminates:
- Weekly status meetings where people read Jira tickets
- Manual status report writeups
- "What's happening with X?" emails
- Slide decks for routine progress updates
You might still have monthly deep-dives or urgent Slack updates. But the weekly grind disappears.
**"How long does setup take?"**
5 minutes to create a project and first milestone. Your first progress report generates automatically on Sunday night, ready for Monday morning.
## Need Help?
- [Documentation](/docs) - Detailed guides for all features
- [Blog](/blog) - Best practices and case studies
- Support - Contact us for personalized assistance
---
**Remember:** The goal isn't to become a project management expert. The goal is to ship great products while keeping stakeholders informed, automatically.
---
#### Quick Start Guide
# Quick Start Guide
This guide will help you create your first project and start tracking velocity in about 10 minutes.
## Prerequisites
Before you begin, make sure you have:
- A GoalPath account (sign up at [goalpath.app](https://goalpath.app))
- At least one team member to collaborate with (optional - you can start solo)
## Step 1: Create Your First Project
1. Click **"New Project"** from the dashboard
2. Enter a project name (e.g., "Q4 Product Roadmap")
3. Add a description (optional)
4. Click **"Create Project"**
You've created your first project! GoalPath automatically creates two special milestones: **Inbox** (for new work) and **Icebox** (for deprioritized ideas).
## Step 2: Add Your First Milestone
Milestones represent significant deliverables on your roadmap. You can create them from the roadmap view or the backlog.
### Using the Visual Roadmap
1. Navigate to the **Roadmap** tab
2. **Double-click** on empty space
3. Choose **Milestone** type
4. Enter a name (e.g., "User Authentication")
5. Set initial status (Concept, Planned, In Progress, or Done)
6. Click **"Create"**
### Milestone Types
GoalPath supports two types of milestones:
- **Milestone**: A specific deliverable or feature (shown with flag icon)
- **Goal**: A higher-level business objective (shown with target icon)
**Tip**: Use Goals for strategic objectives like "Launch to Enterprise Market" and Milestones for concrete deliverables like "SSO Integration Complete".
## Step 3: Add Work Items
Work items are the tasks that make up a milestone. Each item should have an estimate to enable velocity tracking.
1. Click on your milestone to open the details
2. Click **"Add Item"**
3. Enter a title (e.g., "Create login form UI")
4. Add a description (optional but helpful)
5. **Add an estimate** in story points (e.g., 3, 5, 8)
6. Assign owners (team members who will work on this)
7. Click **"Create"**
**Estimation Tip**: Use relative sizing. A 5-point item should take about 2.5x as long as a 2-point item. Consistency matters more than absolute accuracy.
### Breaking Down Work
Try to break down work into items that:
- Can be completed in 1-3 days
- Have clear acceptance criteria
- Are estimated (required for velocity tracking)
- Have at least one owner assigned
**Important**: Only items that reach "Accepted" status are counted in velocity calculations.
## Step 4: Set Your Goal Path (Optional but Recommended)
Define which milestones are on your strategic path:
1. On the **Roadmap** view, click a milestone
2. In the milestone details, toggle **"On Goal Path"**
3. Milestones on the goal path are prioritized and included in forecasts
**Why this matters**: Your roadmap can contain many ideas and alternatives. The goal path shows which milestones you're actually committing to right now.
## Step 5: Create Dependencies (Optional)
Show which milestones depend on each other:
1. On the **Roadmap** view, hover over a milestone
2. You'll see connection handles on the left and right
3. **Drag** from the right handle (source) of the prerequisite milestone
4. **Drop** on the left handle (target) of the dependent milestone
5. A **purple arrow** shows the dependency
**Goal Paths**: Connect milestones to goals with dependencies to show which work contributes to strategic objectives. These appear as **amber arrows**.
## Step 6: Invite Team Members
Collaborate with your team:
1. Click **"Settings"** in the project navigation (Owner role only)
2. Go to the **"Members"** section
3. Click **"Invite Member"**
4. Enter their email address
5. Select their role (Owner, Project Leader, Collaborator, Stakeholder, or Viewer)
6. Click **"Send Invite"**
### Role Permissions
- **Owner**: Full access including settings, member management, roadmap editing, voting, and deletion
- **Project Leader**: All Collaborator and Stakeholder permissions, for lead developers and team leads who need both execution and prioritization authority
- **Collaborator**: Can create/edit items and milestones, update status, but cannot vote or edit settings
- **Stakeholder**: Can vote on priorities and view roadmap, but cannot execute work
- **Viewer**: Read-only access to roadmap and milestones
See [User Roles & Permissions](/docs/features/user-roles) for the complete permission matrix.
## Step 7: Start Tracking Velocity
As your team completes work items:
1. Update item status to **"In Progress"** when work begins
2. Mark items as **"Accepted"** when completed and verified
3. GoalPath automatically records completion dates
4. Velocity is calculated based on the last 6 weeks of accepted items
**Velocity builds over time**: You'll need at least 2-3 weeks of completed work before forecasts become reliable. Keep completing items and marking them "Accepted"!
## Step 8: View Forecasts
Once you have some historical velocity data:
1. Click on a milestone to open details
2. Click the **"Forecast"** tab or panel
3. View probabilistic delivery dates at three confidence levels (50%, 85%, 95%)
Forecasts improve as you complete more work. See [Understanding Project Forecasts](/docs/features/velocity-tracking) for details on how velocity, multitasking penalties, and confidence levels work.
## What's Next?
Now that you have the basics down:
- [Understanding Project Forecasts](/docs/features/velocity-tracking) - Deep dive into how forecasts work
- [Visual Roadmap](/docs/features/visual-roadmap) - Master dependency planning and reverse planning
- [User Roles & Permissions](/docs/features/user-roles) - Understand role-based access control
- [Read best practices on our blog](/blog) - Learn from real-world usage
## Common Questions
### How many work items should I add?
Start with 5-15 items per milestone, based on its size. You can always add more as you break down the work further. The key is having **estimates** on all items.
### When will I see accurate forecasts?
After 2-3 weeks of tracked velocity, forecasts become usable. After 6 weeks, they're quite reliable. The more historical data, the better the predictions.
### Can I edit items after creating them?
Yes! Click on any item to edit its title, description, estimate, status, or owners. Changes are saved immediately.
### What if I have multiple teams?
Create teams within your project and assign milestones to specific teams. Each team builds its own velocity history, and forecasts account for team capacity.
### What's the difference between "Done" and "Accepted"?
Only **"Accepted"** items count toward velocity. Use "Accepted" when work is truly complete and verified. Other statuses (Not Started, In Progress, Done) don't affect velocity calculations.
### How do I use reverse planning?
1. Create a **Goal** representing your desired outcome
2. Create a **Milestone** that must complete before the goal
3. Connect it with a dependency (drag from milestone to goal)
4. Repeat: create the milestone that must complete before that one
5. Continue until you reach something you can start today
6. Mark all these milestones as "On Goal Path"
This creates a dependency chain from current state to your goal.
**Congratulations!** You're now ready to use GoalPath for data-driven roadmap planning. Start completing work items to build your velocity baseline, and watch your forecasts improve!
---
### Features
#### Understanding Project Forecasts
# Understanding Project Forecasts: From Velocity to Delivery Dates
GoalPath calculates delivery forecasts using three inputs: your team's velocity, multitasking load, and the maturity of your estimates. This guide explains the math.
## The Short Version
If you want the gist without the math:
- **GoalPath measures how fast your team works** (velocity = story points completed per week over the last 6 weeks)
- **It penalizes multitasking**: when people juggle too many milestones at once, forecasts account for the productivity loss
- **It adjusts for uncertainty**: the less defined the work, the wider the forecast range
- **You get three dates**: optimistic (things go well), expected (most likely), and pessimistic (things go badly)
- **Forecasts update automatically** as work completes and velocity changes
**Want to improve your forecasts?** Reduce multitasking, estimate all items, and break down ambiguous work. The math below explains exactly why each of these helps.
---
## The Foundation: Work-Weeks
A "work-week" in GoalPath means:
- **1 work-week = 5 business days** (Monday through Friday)
- Weekends are skipped automatically in all calculations
- This ensures estimates reflect actual working time, not calendar time
Calendar weeks (7 days) would overestimate every project by about 28.6%, nearly a third. Work-weeks give you realistic timelines based on when work actually gets done.
## The Three Pillars of Forecasting
The forecasting system rests on three concepts that work together to give you realistic, actionable predictions:
### 1. Velocity: Your Team's Throughput
**Velocity** is the rate at which your team completes work, measured in story points per work-week.
**How GoalPath calculates it:**
- Looks at the last 6 weeks of completed items
- Sums up the story points delivered each week
- Calculates the average: total points ÷ number of weeks
- Tracks the standard deviation to understand consistency
**Example:**
```
Week 1: 15 points
Week 2: 18 points
Week 3: 12 points
Week 4: 20 points
Week 5: 16 points
Week 6: 14 points
Total: 95 points over 6 weeks
Average Velocity: 15.8 points/week
Standard Deviation: 2.9 points (measures consistency)
```
**Why it matters:** Velocity is your team's baseline capacity: how much work they can realistically complete in a week.
### 2. Multitasking Penalty: The Hidden Cost
Context switching reduces productivity. When team members juggle multiple milestones, GoalPath adjusts their effective velocity downward.
**Penalties for concurrent in-progress milestones:**
- **Working on 1 milestone:** 0% penalty (100% effective velocity)
- **Working on 2-3 milestones:** 15% penalty (85% effective velocity)
- **Working on 4-7 milestones:** 30% penalty (70% effective velocity)
- **Working on 8+ milestones:** 50% penalty (50% effective velocity)
**Important:** GoalPath measures **concurrent work**: how many milestones a team member has active in-progress items in right now, not how many milestones they've touched historically. Sequential work on multiple milestones has no penalty.
**How it's applied:**
GoalPath calculates each team member's penalty individually based on how many milestones they're currently working on simultaneously, then aggregates:
```
Example Team:
- Alice: 1 active milestone → 100% effective → 20 pts/week × 1.0 = 20 pts/week
- Bob: 2 active milestones → 85% effective → 18 pts/week × 0.85 = 15.3 pts/week
- Carol: 5 active milestones → 70% effective → 16 pts/week × 0.7 = 11.2 pts/week
Team Effective Velocity: 46.5 pts/week (down from 54 pts/week)
Average Multitasking Penalty: ~14% velocity reduction
```
**Why it matters:** This prevents over-optimistic forecasts by accounting for the real-world cost of divided attention. A team member spreading work across many concurrent milestones will have longer delivery times, even with the same raw velocity.
### 3. Confidence Level: Accounting for the Unknown
Not all forecasts are created equal. Some projects have rock-solid estimates, while others are exploratory and uncertain. The **confidence level** captures this reality.
**Three confidence levels:**
- **High (90%):** Well-understood work, clear requirements, experienced team → 10% buffer
- **Medium (70%):** Some unknowns, moderate complexity → 25% buffer
- **Low (50%):** Exploratory work, many unknowns, new domain → 50% buffer
**How it's used:**
Confidence doesn't just add a fixed buffer. It acts as a multiplier on your total uncertainty, shaping your entire forecast range through uncertainty propagation (more on this below).
**Why it matters:** A low-confidence estimate acknowledges that surprises are likely. Instead of pretending the future is predictable, GoalPath gives you a realistic range.
## Putting It All Together: The Forecast Calculation
Here's how these three pillars combine to produce your forecast.
### Step 1: Calculate Total Work
First, GoalPath estimates the total work remaining:
```
Estimated items: 25 stories × average 8 points = 200 points
Unestimated items: 5 stories × average 8 points (inferred) = 40 points
Total Work: 240 points
```
### Step 2: Apply Multitasking Penalty to Velocity
Next, GoalPath adjusts the team velocity for multitasking:
```
Raw Team Velocity: 54 points/week
Multitasking Penalty: 14% reduction
Effective Velocity: 54 × (1 - 0.14) = 46.4 points/week
```
This gives us the **actual throughput** we can expect given current multitasking load.
### Step 3: Calculate Base Duration
From there, a baseline duration:
```
Base Duration = Total Work ÷ Effective Velocity
Base Duration = 240 points ÷ 46.4 points/week
Base Duration = 5.2 work-weeks
```
This is our starting point, but we're not done yet.
### Step 4: Propagate Uncertainty
GoalPath doesn't just add a simple buffer. Multiple sources of uncertainty are propagated through the calculation:
**Uncertainty sources:**
1. **Estimation Uncertainty** (from unestimated items)
```
5 unestimated items out of 30 total = 17% unestimated
Uncertainty added: 17% × 30% factor = 5% additional buffer
```
2. **Velocity Uncertainty** (from standard deviation)
```
Standard deviation: 2.8 points
Velocity uncertainty: 2.8 ÷ 46.4 = 6% variance
Uncertainty added: 6% × 50% factor = 3% additional buffer
```
3. **Confidence Level Buffer** (based on project confidence)
```
Medium confidence → 25% buffer applied
```
4. **Coordination Uncertainty** (if team-based forecast)
```
Team-based forecast → 10% coordination buffer
```
**Total uncertainty multiplier:**
```
1.0 (base) + 0.05 (estimation) + 0.03 (velocity) = 1.08
1.08 × 1.25 (confidence) × 1.1 (coordination) = 1.49
```
### Step 5: Calculate the Three Scenarios
The uncertainty produces three estimates:
**Optimistic (Best Case):**
```
Minimum Duration = Base × 0.7
Minimum Duration = 5.2 weeks × 0.7 = 3.6 work-weeks
```
This assumes things go better than expected: fewer blockers, faster velocity.
**Most Likely (Expected Case):**
```
Most Likely = Base × (1 + (total uncertainty - 1) × 0.7)
Most Likely = 5.2 × (1 + (1.49 - 1) × 0.7)
Most Likely = 5.2 × 1.34 = 7.0 work-weeks
```
This is our best estimate, including 70% of the uncertainty buffer.
**Pessimistic (Worst Case):**
```
Maximum Duration = Base × Total Uncertainty × 1.2
Maximum Duration = 5.2 × 1.49 × 1.2 = 9.3 work-weeks
```
This assumes things go worse than expected: more blockers, scope creep, etc.
### Step 6: Convert to Calendar Dates
Finally, work-weeks convert to actual dates:
```
Start Date: October 5, 2025
Optimistic End: October 5 + (3.6 weeks × 5 days) = October 23, 2025
Most Likely End: October 5 + (7.0 weeks × 5 days) = November 21, 2025
Pessimistic End: October 5 + (9.3 weeks × 5 days) = December 19, 2025
```
Weekends are skipped automatically, so these are real delivery dates.
## What This Means for Your Project
### Understanding the Range
When you see a forecast like "7.0 work-weeks (Nov 21)" with a range of "3.6 to 9.3 weeks," here's what it tells you:
- **The range is not a mistake.** It's honest uncertainty.
- **The most likely date (Nov 21) includes confidence buffers.** It's not a best-case scenario.
- **The optimistic date (Oct 23) is possible** if everything goes smoothly
- **The pessimistic date (Dec 19) protects you** from unpleasant surprises
### How to Improve Your Forecast
Want tighter ranges and faster delivery? Here's how:
1. **Reduce Multitasking**
- Focus team members on fewer concurrent milestones
- A 30% multitasking penalty means 30% longer delivery times
- Example: 5 active milestones → 2 active milestones saves ~15% of total time
2. **Increase Confidence**
- Break down ambiguous stories into clearer tasks
- Spike on unknowns before committing
- Low → Medium confidence can reduce range by 20%
3. **Estimate More Items**
- Each unestimated item adds uncertainty
- Quick estimation sessions can tighten your forecast
- Even rough estimates (S/M/L) are better than nothing
4. **Build Consistent Velocity**
- Reduce WIP (work in progress) to smooth flow
- Address bottlenecks that create variance
- Consistent velocity = tighter forecast ranges
## Real-World Example: Complete Walkthrough
Let's put this all together with a real project:
**Project:** Mobile App Redesign
**Team Setup:**
- 4 developers on the team
- 2 developers focused on this milestone (1 milestone each)
- 1 developer working on 2 concurrent milestones
- 1 developer working on 5 concurrent milestones
**Work Breakdown:**
- 45 estimated stories: 360 points
- 8 unestimated stories
- Average story size: 8 points
- Estimated total with unknowns: 424 points
**Velocity Data (last 6 weeks):**
- Team raw velocity: 52 points/week
- Standard deviation: 6.2 points (12% variance, somewhat inconsistent)
**Confidence Level:** Medium (some unknowns in the UI framework)
**Step-by-step calculation:**
1. **Calculate Multitasking Penalty**
```
Dev 1: 20 pts/week × 1.0 (1 milestone) = 20 pts/week
Dev 2: 18 pts/week × 1.0 (1 milestone) = 18 pts/week
Dev 3: 16 pts/week × 0.85 (2 milestones) = 13.6 pts/week
Dev 4: 14 pts/week × 0.7 (5 milestones) = 9.8 pts/week
Effective Team Velocity: 61.4 pts/week (down from 68 pts/week)
Multitasking Penalty: 10% average reduction
```
2. **Calculate Base Duration**
```
424 points ÷ 61.4 pts/week = 6.9 work-weeks
```
3. **Propagate Uncertainty**
```
Estimation uncertainty: 8/53 unestimated = 15% × 30% = 4.5%
Velocity uncertainty: 6.2/61.4 = 10% × 50% = 5%
Confidence buffer: Medium = 25%
Team coordination: 10%
Total multiplier: 1.0 + 0.045 + 0.05 = 1.095
With confidence: 1.095 × 1.25 × 1.1 = 1.51
```
4. **Calculate Range**
```
Optimistic: 6.9 × 0.7 = 4.8 work-weeks (24 business days)
Most Likely: 6.9 × 1.36 = 9.4 work-weeks (47 business days)
Pessimistic: 6.9 × 1.51 × 1.2 = 12.5 work-weeks (62 business days)
```
5. **Convert to Dates** (starting October 5, 2025)
```
Optimistic: November 7, 2025
Most Likely: December 12, 2025
Pessimistic: January 2, 2026
```
**What the team can do:**
- **Focus the dev on 5 milestones → 2 milestones**: Would reduce multitasking penalty from 10% to ~7%, saving ~3% of total time (≈10 days earlier)
- **Estimate those 8 stories**: Would reduce uncertainty by 4.5%, tightening the range significantly
- **Spike on UI framework unknowns**: Could raise confidence from Medium → High, reducing buffer from 25% to 10% (≈2 weeks earlier)
**Combined impact:** Could shift "Most Likely" from Dec 12 to mid-November, a month faster!
## Transparency and Continuous Improvement
Every forecast includes detailed metadata that captures:
- Base velocity before penalties
- Actual multitasking penalty applied
- Each uncertainty factor and its impact
- The complete calculation formula
This transparency serves two purposes:
1. **Trust:** You can see exactly how the estimate was calculated
2. **Learning:** Over time, actual delivery can be measured against predictions to refine penalty factors
Every forecast includes this metadata so you can track forecast accuracy over time and make informed decisions about reducing multitasking or improving estimates.
## The Bottom Line
Project forecasting combines your team's velocity, multitasking load, and estimation maturity to give you honest delivery ranges.
When you see your forecast:
- The **multitasking penalty** shows the real cost of divided attention
- The **confidence level** shapes your uncertainty buffers
- The **velocity** drives your baseline throughput
- The **range** acknowledges that the future is uncertain
- The **work-weeks** ensure we're counting actual working time
Armed with this understanding, you can make informed decisions: accept the range, reduce multitasking, increase estimates, or adjust scope. Forecasts are math, not promises. Transparent math you can act on.
## Delivery Probability Lines: Visualizing Delivery Risk
When prioritizing items in a milestone, you may notice colored lines appearing between items. These are **Delivery Probability Lines**, a visual tool that helps you understand delivery risk based on your team's velocity.
### What Are Delivery Probability Lines?
Delivery Probability Lines show you where your delivery thresholds fall based on team velocity and variance. They answer the question: "If we work at our current pace, how much can we deliver in 1 week? 2 weeks? 3 weeks? 4 weeks?"
Each line represents a time horizon (1-6 weeks) and comes in three colors:
- **Green (Best Case):** Based on optimistic velocity (90th percentile)
- **Amber (Probable):** Based on median velocity (50th percentile)
- **Red (Worst Case):** Based on pessimistic velocity (10th percentile)
### How It Works
The lines are calculated using your team's velocity data:
1. **Calculate velocity bounds** using statistical confidence intervals:
- **Optimistic velocity** = Effective velocity + (1.28 × standard deviation)
- **Probable velocity** = Effective velocity (median)
- **Pessimistic velocity** = Effective velocity - (1.28 × standard deviation)
2. **Calculate capacity** for each time horizon:
- For each week (1 through 6), multiply velocity by weeks to get deliverable points
3. **Position lines** by calculating cumulative story points:
- Lines appear after the last item whose cumulative total fits within the capacity
### Example
Imagine a milestone with these items in priority order:
```text
Item 1: 3 points → Cumulative: 3 pts
Item 2: 5 points → Cumulative: 8 pts
───────────────────────────────────◀ 1 week (green: best case)
Item 3: 4 points → Cumulative: 12 pts
───────────────────────────────────◀ 1 week (amber: probable)
Item 4: 6 points → Cumulative: 18 pts
───────────────────────────────────◀ 1 week (red: worst case)
───────────────────────────────────◀ 2 weeks (green: best case)
Item 5: 8 points → Cumulative: 26 pts
───────────────────────────────────◀ 2 weeks (amber: probable)
Item 6: 5 points → Cumulative: 31 pts
```
If your team's velocity is 12 pts/week with ±3 pts standard deviation:
- **Best case 1 week:** ~15 pts (Items 1-3)
- **Probable 1 week:** ~12 pts (Items 1-2)
- **Worst case 1 week:** ~9 pts (Items 1-2)
### Using Probability Lines for Prioritization
Probability lines help you make informed prioritization decisions:
1. **Identify high-priority items:** Anything above the first green line is highly likely to be delivered within a week
2. **Manage stakeholder expectations:** Use the amber and red lines to communicate realistic delivery ranges
3. **Assess risk:** If a critical item falls below the red line for your target delivery date, you may need to:
- Reprioritize to move it higher
- Reduce scope of items above it
- Accept the delivery risk
### When Lines Appear
Delivery probability lines are shown when:
- The milestone is **In Progress** or **Planned** (not Inbox, Icebox, or Done)
- Forecast data is available with velocity > 0
- Items have story point estimates
**Team-Aware Velocity:** If a team is assigned to the milestone, the lines use that team's specific velocity. Without a team assignment, project-wide velocity is used. This means you'll get more accurate predictions when you assign teams to milestones.
### Interpreting the Spread
The distance between green, amber, and red lines for the same week tells you about delivery uncertainty:
- **Lines close together:** Consistent velocity, predictable delivery
- **Lines spread apart:** High variance, less predictable delivery
Wide spreads suggest you might want to focus on improving velocity consistency (reduce WIP, address blockers, etc.) before committing to aggressive deadlines.
---
#### User Roles & Permissions
# User Roles & Permissions
GoalPath has five user roles. Each role is designed for a specific type of involvement in a project.
## Role Overview
| Role | Primary Use Case | Key Permissions |
| ------------------ | ---------------------------- | ------------------------------------------------ |
| **Owner** | Project administrators | Full access including settings and billing |
| **Project Leader** | Lead developers & team leads | All Collaborator permissions plus roadmap planning and voting |
| **Collaborator** | Development team members | Work on items, create milestones, view reports |
| **Stakeholder** | Business stakeholders & PMs | View roadmap, vote on priorities, track progress |
| **Viewer** | Read-only observers | View roadmap and milestones, comment on items |
---
## Owner
Owners have full control over the project. This includes all the permissions of every other role, plus administrative functions no one else can access.
**What Owners can do:**
- Full access to all features and pages
- Modify project settings and configuration
- Invite, remove, and change member roles
- Manage billing and subscription
- Create and manage teams
- Participate in milestone prioritization voting
- Create and work on items
**What Owners cannot do:**
- Nothing is off-limits
**Accessible pages:** Dashboard, Search, Standup, Board, Roadmap, Milestones, Time Report, Voting, Members, Settings
Keep Owner access to 1-2 trusted team members. Most people should be Collaborators.
---
## Project Leader
Project Leaders have all Collaborator permissions plus the ability to vote on milestone priorities. Use this role for lead developers or team leads who need both execution and prioritization authority.
**What Project Leaders can do:**
- Create and manage items
- Move items through the full workflow: NotStarted, Started, Finished, Delivered, Accepted
- Add story point estimates
- Create milestones
- View time reports and velocity metrics
- Participate in daily standups
- Access the kanban board
- View team members
- Reorder items and milestones on the roadmap (business value sort / planning)
- Vote on milestone prioritization
**What Project Leaders cannot do:**
- Modify project settings
- Manage billing
- Invite or remove members
**Accessible pages:** Dashboard, Search, Standup, Board, Roadmap, Milestones, Time Report, Voting, Members
---
## Collaborator
Collaborators are the core execution team. They do the work: create items, update status, add estimates, and drive milestones forward.
**What Collaborators can do:**
- Create and manage items
- Move items through the full workflow: NotStarted, Started, Finished, Delivered, Accepted
- Add story point estimates
- Create milestones
- View time reports and velocity metrics
- Participate in daily standups
- Access the kanban board
- View team members
**What Collaborators cannot do:**
- Vote on milestone prioritization
- Access the milestone planning view used to reorder milestones or sort by business value (limited to Owner and Project Leader). Item-level reordering within a milestone's work queue is a separate permission and is still available to Collaborators (see the Permission Matrix below).
- Modify project settings
- Manage billing or members
**Accessible pages:** Dashboard, Search, Standup, Board, Roadmap, Milestones, Time Report, Members
Assign Collaborator to developers, designers, and anyone actively working on deliverables.
---
## Stakeholder
Stakeholders have a business-level view of the project. They can see the roadmap and milestones, vote on priorities, but don't get into the day-to-day execution details.
**What Stakeholders can do:**
- Vote on milestone prioritization
- View the roadmap and project timeline
- View milestones and track progress
- Comment on items
- Search content
- View team members
**What Stakeholders cannot do:**
- Create or edit items
- Access the kanban board
- View time reports or velocity metrics
- Participate in standups
- Modify any project settings
**Accessible pages:** Dashboard, Search, Roadmap, Milestones (read-only), Voting, Members
Good fits for the Stakeholder role: product managers influencing priorities, executives monitoring progress, customer representatives voting on feature priorities.
---
## Viewer
Viewers can see the roadmap and milestones, and can leave comments on items. Beyond that, no editing, no voting, no access to execution details.
**What Viewers can do:**
- View the roadmap (read-only)
- View milestones and progress (read-only)
- Comment on items
- Search content
- View team members
**What Viewers cannot do:**
- Create or edit items or milestones
- Vote on priorities
- Access standup, board, or time reports
- Modify any project settings
**Accessible pages:** Dashboard, Search, Roadmap (read-only), Milestones (read-only), Members
See the [Viewer Role Guide](/docs/process/roles/viewer) for when to use this role and how it differs from Stakeholder.
Viewers can see all roadmap and milestone data. Only grant Viewer access to people you trust with that information.
---
## Permission Matrix
| Feature | Owner | Project Leader | Collaborator | Stakeholder | Viewer |
| ----------- | ------ | -------------- | ------------ | ----------- | ------ |
| Dashboard | Yes | Yes | Yes | Yes | Yes |
| Search | Yes | Yes | Yes | Yes | Yes |
| Roadmap | Full | Full | Full | Read | Read |
| Milestone planning view (milestone reorder / business value sort) | Yes | Yes | No | No | No |
| Item reordering / moving between milestones (work queue, kanban) | Yes | Yes | Yes | No | No |
| Milestones | Edit | Edit | Edit | Read | Read |
| Members | Manage | View | View | View | View |
| Voting | Yes | Yes | No | Yes | No |
| Standup | Yes | Yes | Yes | No | No |
| Board | Yes | Yes | Yes | No | No |
| Time Report | Yes | Yes | Yes | No | No |
| Comments | Yes | Yes | Yes | Yes | Yes |
| Settings | Yes | No | No | No | No |
---
## Changing User Roles
Only Owners can change member roles. Go to the **Members** page and click the role dropdown next to any member's name. Changes take effect immediately.
### Role Assignment Tips
1. Start with the minimum role needed, then upgrade if necessary.
2. Keep Owner access to 1-2 people per project.
3. Collaborator is the right default for anyone actively doing work.
4. Use Stakeholder for business stakeholders who need to influence priorities.
5. Use Viewer for external observers or temporary access.
### Common Upgrade Paths
- **Viewer to Stakeholder:** Observer starts participating in prioritization decisions.
- **Stakeholder to Collaborator:** Stakeholder starts executing work.
- **Collaborator to Project Leader:** Developer takes on a lead role.
- **Collaborator to Owner:** Trusted team member needs administrative access.
---
## Frequently Asked Questions
**Can a user have different roles in different projects?**
Yes. Roles are project-specific. You can be an Owner in one project and a Collaborator in another.
**What happens when a member's role is changed?**
The change takes effect immediately. The user will see updated navigation and permissions on their next page load.
**Can Owners remove themselves?**
Yes, but every project must have at least one Owner. The last Owner cannot remove themselves without first assigning another Owner.
**Do Stakeholders see all project data?**
Stakeholders see the roadmap, milestones, and voting data. They cannot access standup updates, the board, or time reports.
**Can Viewers see sensitive information?**
Viewers can see all roadmap and milestone data. If you need to restrict information further, use separate projects rather than relying on role restrictions.
**Do all roles count toward billable seats?**
All roles count toward billable project seats except Viewer. This makes Viewer the appropriate default when granting access to external observers who don't need a paid seat.
---
Go to the **Members** page to invite users and assign roles based on their involvement.
---
#### Automatic Progress Reports
# Automatic Progress Reports
Stop writing status reports. Start sharing progress automatically.
GoalPath's **Automatic Progress Reports** turn your team's actual work (completed items, blockers, velocity changes) into clear, consistent weekly narratives for leadership. No extra reporting. No status meetings. Just trustworthy updates that write themselves.
**Save Hours Every Week**: Teams report saving 3-5 hours per week that previously went into writing status updates, preparing slide decks, and attending status meetings.
## How It Works
### The Two-Tier System
Progress reports use a hierarchical approach that mirrors how organizations think about work:
#### 1. Milestone Summaries (Foundation Layer)
Every Sunday evening (10pm UTC), GoalPath analyzes each active milestone and generates a focused summary:
- **What was delivered** - Completed items with enough context for stakeholders to understand value
- **Active blockers** - Only mentioned if significant (no noise)
- **One actionable insight** - What to focus on next week
These summaries are synthesized from:
- Completed work items (with descriptions and task details)
- Activity history (who did what when)
- Unresolved highlights flagged by your team
- Current in-progress work
- Upcoming items in execution order
- Past 4 weeks of context for pattern recognition
**No Activity? No Problem**: If a milestone had no activity, the summary clearly states this. No fake progress, no spin. If there are blockers but no activity, they're formatted clearly as a structured list.
#### 2. Project Progress Reports (Executive Layer)
All milestone summaries roll up into a single, coherent **project-level progress report** structured for leadership:
**Overview** (1 paragraph)
- What changed this week
- Current delivery situation: going well / steady / facing challenges
- One choice or consideration for leadership (optional, only when relevant)
- Framed for external stakeholder understanding
**Metrics** (factual data)
- Active blockers (highlighted when > 0)
- Items completed this week
- Work in progress (items and milestones at end of week)
- Velocity (story points per week, when available)
- Ordered by stakeholder priority, no interpretation or commentary
**Milestone Progress** (synthesis, not paste)
- Each milestone gets 1-2 sentences maximum
- Focus on what changed since last week
- Recommendations consolidated (not repeated per milestone)
**Upcoming Milestones Forecast** (current week only)
- Data-driven delivery forecasts for in-progress and next planned milestones
- Best case, expected, and risk-adjusted completion dates
- Grouped by team with clear execution order
- Active blockers highlighted per milestone
- Concept milestones marked (less reliable estimates)
- Based on your team's actual velocity data, not guesswork
**Looking Ahead** (1 paragraph)
- What to watch next week
- Known dependencies or time constraints
- Natural progression from current work
- Upcoming holidays that might affect velocity
- Purely informational - no recommendations or action items
**Length**: 400-600 words, concise enough for busy executives to scan in 2-3 minutes and detailed enough to actually understand what's happening.
**Holiday Awareness**: The system knows when holidays are coming (Christmas, Easter, New Year's, etc.) and includes this context in updates so stakeholders understand velocity variations without raising false alarms.
### Upcoming Milestones Forecast: Data-Driven Delivery Dates
A key part of progress reports is the **Upcoming Milestones Forecast table**, which appears automatically in current week reports (not historical backfills).
Forecasts are powered by GoalPath's [velocity tracking](/docs/features/velocity-tracking) system, which continuously measures your team's actual delivery speed and uses that data to predict realistic completion dates.
#### How It Works
The forecast table shows delivery predictions for:
- **All in-progress milestones** (currently being worked on)
- **Next 2 planned milestones per team** (what's coming up)
For each milestone, you see:
1. **Milestone** - With concept indicator if forecasts are less reliable
2. **Expected** - Most likely completion date based on current velocity
3. **Best case** - Earliest possible completion if everything goes perfectly
4. **Risk-adjusted** - Latest date accounting for typical delays
5. **Notes** - Important context (like "Concept milestone" or active blocker counts)
Teams appear as section headings above their milestones (e.g., "### Backend"), not as a column in the table. Blocker counts are appended to the Notes column when present (e.g., "In Progress: 2 blockers").
**Date Format**: All dates shown as `YYYY-WNN` (ISO week format), e.g., `2025-W14` = Week 14 of 2025
#### The Math Behind Forecasts
Forecasts aren't guesses. They're calculated from your team's actual execution data:
- **Velocity tracking**: Story points completed per week per developer
- **Historical patterns**: How accurate past estimates have been
- **Current capacity**: Who's actively working on what
- **Execution order**: Dependencies and planned sequencing
- **Standard deviation**: Variability in your team's delivery times
The system pre-calculates forecasts weekly and stores them, so reports show consistent dates throughout the week. This prevents "date jumping" where forecasts change daily.
**Concept Milestones**: Milestones marked as "concept" don't have detailed stories yet, so forecasts are based on high-level estimates and execution order. These are less reliable than milestones with fully broken-down work.
#### Blocker Detection
The "Blockers" column counts items within each milestone that have **active, unresolved highlights**. This surfaces:
- Technical blockers (API issues, infrastructure problems)
- Dependency blockers (waiting on another team)
- Decision blockers (need leadership input)
- Risk highlights (potential issues flagged by team)
When a milestone shows "2 blockers," stakeholders can immediately see which work streams need attention.
#### Team Grouping
For projects with teams enabled, the forecast table groups milestones by team alphabetically, then shows them in execution order within each team. This makes it easy to see:
- Which teams have heavy upcoming workloads
- Where blockers are concentrated
- How work is distributed across the organization
For single-team or solo projects, the table simply lists all milestones in execution order.
#### When Forecasts Appear
**Current Week Reports Only**: The forecast table only appears in reports for the current week. Historical reports don't include forecasts because they're backward-looking. Forecasts are about what's ahead, not what already happened.
If you manually generate a report mid-week, it will include the forecast. But if you backfill last week's report, no forecast appears.
#### Example Forecast Table
```markdown
## Upcoming Milestones (Beta)
⚠️ **Beta Feature**: These forecasts are based on your team's velocity data. Dates are estimates and may change as work progresses.
### Backend
| Milestone | Expected | Best case | Risk-adjusted | Notes |
|---|---|---|---|---|
| User Authentication | 2025-W15 | 2025-W14 | 2025-W17 | |
| Payment Integration | 2025-W18 | 2025-W16 | 2025-W20 | In Progress — 2 blockers |
### Frontend
| Milestone | Expected | Best case | Risk-adjusted | Notes |
|---|---|---|---|---|
| Dashboard Redesign | 2025-W14 | 2025-W13 | 2025-W15 | In Progress — 1 blocker |
| Mobile Responsiveness | 2025-W17 | 2025-W15 | 2025-W19 | Concept milestone |
```
Teams appear as section headings above their milestones (e.g., "### Backend" followed by that team's rows).
This table immediately shows stakeholders:
- Frontend will likely finish Dashboard Redesign this week or next
- Payment Integration has 2 blockers that need attention
- Mobile Responsiveness is still in concept phase (less certainty)
- Backend has heavier upcoming workload (Authentication → Payment)
### The Trust Factor: Evidence, Not Opinion
Traditional status reports have a fundamental problem: they're based on what people _say_ is happening, not what's _actually_ happening.
GoalPath's progress reports are different:
| Traditional Status Reports | GoalPath Progress Reports |
| ------------------------------- | ------------------------------------ |
| Opinion-based | Evidence-based |
| Manually written | Auto-generated from real data |
| Optimistic by default | Grounded in execution |
| Inconsistent format | Structurally consistent |
| Lost in Slack/email | Builds organizational memory |
| "Everything is green" | Honest about blockers |
| Delivery dates are guesses | 3-point forecasts from velocity data |
| No blocker visibility | Active blockers per milestone |
| Generic status across milestones | Forecast table with execution order |
When leadership asks "what's happening with Project X?", they get a factual, consistent narrative with data-driven delivery forecasts, not political spin or someone's best guess.
### You Stay in Control
**Critical principle**: The AI drafts. You decide.
Every report is **fully editable** before it's shared:
- AI missed context? Add it.
- Tone not quite right? Adjust it.
- Want to emphasize something? Do it.
All edits are tracked with a `humanEdited` flag and activity logs, so there's always a clear record of what was AI-generated vs. human-refined.
## Getting Started
Progress reports are **enabled by default** for all projects. Your first report generates automatically on Sunday evening. No setup required. It's ready for you Monday morning.
**Timezone Note**: Milestone summaries generate at 10pm UTC every Sunday, followed by project-level progress reports at 11pm UTC. This ensures all team activity from the previous week is captured, and milestone summaries are completed before project-level aggregation.
### Configuring Your First Report
Before your first report generates, optionally customize settings in **Project Settings** → **Automation**:
- **Language**: Choose from English, Swedish, Danish, Norwegian, German, French, Spanish, Italian
- **Auto-send email**: Toggle whether reports email automatically or require manual review
- **Default recipients**: Add team members and stakeholders who should receive reports
These are optional. Reports work perfectly with default settings (English, manual review, no auto-send).
## Configuration Options
### Language Settings
GoalPath supports 8 languages with consistent, proper terminology:
- **English** (default)
- **Swedish**
- **Danish**
- **Norwegian**
- **German**
- **French**
- **Spanish**
- **Italian**
Reports are generated entirely in your chosen language, not just translated, but written naturally from scratch. This includes the forecast table with proper date formats and terminology.
### Email Settings
**Auto-send Email**
- **On**: Reports automatically email to default recipients after generation
- **Off**: Reports generate as drafts; you manually review and send
**Default Recipients**
- Add any email address (team members or external stakeholders)
- Recipients are stored as `name ` format
- Each recipient receives the same report via email
- Reports are also always available in the GoalPath dashboard
**Pro Tip**: Add your VCs, investors, or board members as recipients. They get consistent, evidence-based communication, and the clear format makes it easy for them to share with their networks.
### Custom Prompts (Advanced)
For teams with specific communication preferences, you can customize the AI prompts in **Project Settings**. The **structural format is fixed**:
**Fixed Structure (Cannot Change)**:
1. Overview section (1 paragraph executive summary)
2. Metrics section (factual list: blockers, completions, WIP, velocity)
3. Milestone Progress section (1-2 sentences per milestone)
4. Upcoming Milestones Forecast table (current week only, data-driven)
5. Looking Ahead section (1 paragraph, informational only)
**What You Can Customize**:
**Custom Milestone Summary Prompt**
- Adjust tone (more technical vs. business-focused)
- Add company-specific terminology
- Emphasize particular types of information
**Custom Project Update Prompt**
- Change emphasis within sections
- Adjust tone for different stakeholder types
- Add specific guidance about what to highlight
- Modify language style preferences
**What You Cannot Customize**:
- Section order or structure
- Forecast table format or logic
- Metrics selection or ordering
- Multi-language terminology (uses system-defined translations)
**Advanced Feature**: Custom prompts require understanding of prompt engineering. Start with defaults, which are calibrated for broad effectiveness. Only customize if you have specific, documented needs.
## Real Benefits by Role
### For Individual Contributors
**No status report homework** - Your completed work speaks for itself
**Credit where credit is due** - Items you finish show up with full context
**Blockers reach leadership** - Highlights you flag get automatic visibility
**Focus on building** - Less time explaining, more time creating
### For Team Leads and Project Managers
**Reclaim 3-5 hours weekly** - No more manual status writeups or slide decks
**Consistent communication** - Same structure, same quality, every week
**Historical patterns visible** - See trends over months: recurring issues? velocity changes?
**Onboard stakeholders instantly** - Historical updates create perfect context
### For Executives and Leadership
**Signal over noise** - One concise update per project, per week
**Data-driven forecasts** - See 3-point delivery estimates (best/expected/risk-adjusted) for all upcoming work
**Blocker visibility** - Know exactly which milestones have active blockers before they become critical
**Earlier risk detection** - Issues surface in writing with evidence before they're critical
**No status meetings needed** - Read asynchronously, ask questions in context
**Evidence-based decisions** - Grounded in real velocity data, not optimistic spin
**Organizational memory** - Auditable record of what happened and when
### For External Stakeholders (VCs, Investors, Board)
**Consistent communication** - Professional, structured updates they can rely on
**Delivery forecasts** - See realistic completion dates with confidence ranges, not just "on track"
**Portfolio visibility** - If they're on multiple companies' updates, they see clear comparisons
**Authentic progress tracking** - Evidence-based reporting builds trust
**Forward-friendly** - Clean format makes it easy to share with their networks
## Best Practices
### Add External Stakeholders as Recipients
Don't just use progress reports for internal communication. **Add VCs, investors, advisors, and board members** as recipients.
Why this matters:
- **Builds trust**: Consistent, evidence-based communication with data-driven forecasts
- **Reduces update requests**: They get information proactively
- **Professional signal**: Shows you're a disciplined, transparent team
When a new investor, board member, or executive joins, backfill the last 8-12 weeks of reports and add them to ongoing recipients. This creates instant context without scheduling a "catch-up meeting."
## Common Questions
### Does this replace all status communication?
No, but it significantly reduces it. You still might have:
- Quick Slack updates for urgent issues
- Monthly or quarterly deep-dive reviews
- One-on-one conversations about career/performance
But it eliminates:
- Weekly status meetings where people read Jira tickets
- Manual status report writeups
- "What's happening with X?" emails
- Slide decks for routine progress updates
### What if we don't use story points?
Progress reports don't require story points. They work with item completion. Story points are used for velocity-based forecasting when available, but reports work perfectly without them.
If you track items as Done/Not Done, reports work perfectly. The forecast table will still show planned dates based on execution order.
### What happens if there's no activity?
If a milestone has zero activity and zero blockers, the summary says so clearly:
> "No development activity this week."
If there's no activity but there are blockers, they're formatted clearly:
> "No development activity this week.
>
> **2 active blockers:**
>
> 1. API rate limit blocking user import
> 2. Design review pending for checkout flow"
No fake progress. No spin.
### What if we have multiple teams?
Progress reports work great for multi-team projects:
- Each team's velocity is tracked independently
- Milestones can be team-specific or cross-team
- Reports synthesize all team activity into one coherent narrative
- The forecast table groups milestones by team alphabetically
Leadership gets a single report showing how all teams contribute to project progress, with clear team-based forecasts.
---
#### Watching Items
# Follow an item without being assigned to it
Not everyone who cares about an item is the one doing the work. A manager wants to know when a feature ships. A designer wants a heads-up when the item they scoped moves to Started. A bug reporter wants to know when their bug is fixed. None of them need to be an owner. They just want to know what happens next.
**Watching** solves this. Click the eye icon once and you'll get an email every time something meaningful happens to that item, until you stop watching it.
## Watch an item
Open any item and click **Watch** in the header. The button fills in and becomes **Watching**. Click it again any time to unwatch.
In compact views (kanban cards, tight list rows), the same toggle appears as just the eye icon: outlined when you're not watching, filled when you are.
Owners, Collaborators and Project Leaders can watch items. Viewers and Stakeholders can't, so the Watch button doesn't render for them at all rather than sitting there disabled.
## Who's watching
Items with watchers show a small stack of avatars in the header, to the left of the requester's avatar. If nobody is watching, no avatar stack renders. The Watch button is the only thing there.
Owners and Project Leaders can click the watcher stack to open a dropdown and remove other watchers, the same way they manage the owners list.
## The Watching view
Every project has a dedicated **Watching** page, linked from the sidebar. It lists every item you're currently watching, sorted by most recently updated, with an inline unwatch button on each row.
The page has three tabs. **Watching** is this list. **Created by me** shows items you created, useful for spotting things you filed but never explicitly clicked Watch on. **Mentions** shows everywhere someone has @-mentioned you, which is a separate thing from watching and is covered in [Mentions and Notifications](/docs/features/mentions-and-notifications).
You land on Mentions when you have unread ones waiting, and on Watching otherwise.
Accepted items collapse behind a **Show accepted** toggle so the list defaults to showing what's still moving. Click it to reveal items you're watching that have already been accepted.
## What triggers an email
You'll get an email when a watched item:
- Gets a new comment (the full comment is inline in the email, no need to click through)
- Moves to **Started**, **Finished**, **Rejected**, or **Accepted**
- Moves to the Icebox
- Is deleted (the email shows the item's last known state, since the item itself is gone)
**You never get an email about your own actions.** If you're the one who commented or changed the status, watching doesn't notify you about it.
Emails about the same item thread together in Gmail, Outlook, and other clients, so a run of comments and status changes on one item stays in a single conversation instead of flooding your inbox with separate messages.
## What watching isn't
Watching is deliberately kept simple:
- **It's not the same as being assigned.** "My Items" (things you own) and "Watching" (things you follow) are always separate lists. An item can be both, but the two never merge.
- **There's no digest.** Every event sends its own email, since watching is opt-in and volume stays low.
- **There's no unsubscribe link.** Manage what you're watching from the item itself or the Watching view. Both are always one click away.
- **There's no auto-watch.** Being an owner, requester, commenter, or the person someone just @-mentioned doesn't automatically make you a watcher. You have to click Watch.
## Via MCP
If you're working with an AI coding assistant connected to GoalPath, ask "what am I watching?" The `list_my_watched_items` tool returns the same list as the Watching view, across all your projects. It's kept separate from `list_my_items` ("what's assigned to me") for the same reason the UI keeps them apart: owning and watching are different relationships to an item.
---
#### Mentions and Notifications
# Pull someone into the work, without leaving the work
Discussion happens on items. Reaching the person who needs to see it usually doesn't. You write the comment, then you go and tell them in Slack, or in a meeting, or by tapping them on the shoulder.
**Mentions** close that gap. Type `@`, pick a name, and that person finds out.
## Mention someone
Type `@` anywhere you can write rich text. A list of project members opens. Keep typing to narrow it, then press Enter or click a name. Names and email addresses both match, so `@anna` and `@anna@` get you to the same person.
Full names work too. Typing `@Anna Lind` keeps the list open across the space and narrows to Anna. You don't have to remember whether she's the only Anna in the project.
The mention is saved as a link to that person. Click it to open their profile: their role and email, what they're currently working on, and their recent activity in the project.
You can mention someone in:
- An item description
- A milestone description
- A comment on an item
- A comment on a milestone
Only active members are suggested. Someone whose membership has been disabled won't appear in the list, though older mentions of them still render and still link to their profile.
Mentioning yourself does nothing. You don't get notified about your own writing.
## What the mentioned person sees
Mentions collect on the **Watching** page, under a **Mentions** tab. The sidebar shows an unread count next to Watching, so a mention is visible from anywhere in the project without going looking for it.
Each card shows who mentioned you, which item or milestone it was on, and the sentence you were named in. Open the page with unread mentions waiting and Mentions is the tab you land on. Otherwise you land on Watching, as before.
## One thread per item, not one per mention
Five mentions across five comments on the same item produce one card, not five.
Each card is a thread: one per person, per item or milestone. A new mention updates the thread in place, moves it to the top, and marks it unread again if you'd already read it. That last part is what makes a deliberate second ping work after someone has read and moved on.
A thread named you more than once says so, with a count.
## Reading and deferring
Mark a thread read with the envelope button on the card. Mark it unread again with the same button. Marking something back to unread is how you defer it, so it isn't a lesser action than reading it.
**Mark all read** clears everything at once.
Cards hold their position while you work through them. A thread you mark read doesn't jump out from under your cursor, which matters when you're clearing several in a row.
## Watching an item you were pulled into
Being mentioned doesn't subscribe you to anything.
Some tools add you to an item the moment someone names you. GoalPath doesn't. Being named by a colleague shouldn't quietly grow the list of things you get email about.
Instead, a mention on an item carries the same eye icon you'd find on the item itself. One click and you're watching it, with everything that means: an email on every new comment and status change. It's opt-in and you can undo it.
Mentions on a milestone have no such button, because milestones have no watchers. Neither do mentions on items for Viewers and Stakeholders, who can read and comment but can't watch.
## What mentions don't do
Mentions are deliberately quiet:
- **No email.** Mentions live in the app. Watching an item is what sends you email.
- **No auto-watch.** Being mentioned notifies you once. It doesn't subscribe you. See [Watching Items](/docs/features/watching) for what watching does send you.
- **No group mentions.** There's no `@team` or `@everyone`. Those are the main source of noise in every tool that has them.
- **No notifications for anything else.** Status changes, assignments and comments on watched items don't produce mentions. Only someone naming you does.
- **No mentioning people outside the project.** You can't invite someone by mentioning them.
## Editing text that mentions someone
Saving a description again without changing it notifies nobody, even though the mentions are still in there.
Editing to *add* a mention does notify the person you added. This is a deliberate difference from tools where a name added during an edit silently reaches no one.
Removing a mention notifies nobody and leaves the existing thread alone. Threads outlive the text that created them, the same way they outlive a deleted comment.
## Names in old mentions
A mention stores the name as it was written. If someone changes their display name, text that already mentions them keeps the old one.
This is on purpose. Re-checking every name every time a comment renders would put a lookup in front of text that should just appear. The link still resolves to the right person, because the mention stores their identity, not their name.
## Who can be mentioned
Anyone in the project, in any role. Stakeholders and Viewers can comment, so they can be named in a discussion, and they read their mentions on the same Watching page as everyone else.
---
#### Visual Roadmap
# Visual Roadmap
The visual roadmap provides an interactive, drag-and-drop interface for planning and visualizing your project's milestones and business goals. Unlike traditional linear lists, the roadmap shows how work items relate to each other and contribute to your strategic objectives.
The visual roadmap uses a directed graph to show dependencies and goal relationships, making it easy to understand the critical path and how multiple workstreams contribute to business outcomes.
**Reverse Planning**: A practical approach is working backwards from your goals. Start with your desired outcome, then build the dependency chain in reverse by asking "What must be done before this?" This ensures every milestone directly serves your goal.
## Goals vs Milestones
The roadmap visualizes two distinct types of items:
### Milestones (Flag Icon)
Milestones are concrete, deliverable work items that your team executes. They represent specific features, releases, or deliverables that can be planned, worked on, and completed.
**Characteristics:**
- Contain work items (tasks) that teams complete
- Have detailed progress tracking
- Can be assigned to specific teams
- Track velocity and generate forecasts
- Move through status lifecycle: Concept → Planned → In Progress → Done
**Visual Appearance:**
- Rectangle shape with flag icon
- Shows team avatar and business value score
- Displays progress chart when in progress
- Color-coded by status (gray=Concept, purple=Planned, blue=In Progress, green=Done)
### Goals (Target Icon)
Goals represent high-level business objectives or strategic outcomes. They provide context and direction for your work, showing _why_ you're building certain features.
**Characteristics:**
- Multiple milestones can contribute to achieving a single goal
- Don't contain work items directly
- Help prioritize and align team efforts
- Provide business context for technical work
**Visual Appearance:**
- Circular shape with target icon, visually distinct from milestones
- Shows business value score
- Same color-coding by status as milestones
**Multiple Paths to Goals**: Because multiple milestones can point to the same goal, you can track progress toward strategic objectives from different angles simultaneously. Your **goal path** (amber arrows) shows which of those routes you're actively pursuing right now.
## Dependencies and Goal Paths
The roadmap visualizes two types of relationships between items:
### Dependencies (Purple Arrows)
Dependencies show prerequisite relationships between milestones. A purple arrow from Milestone A to Milestone B means "A must be completed before B can start."
**Features:**
- Animated when on the critical path
- Prevents circular dependencies
- Used for forecast calculations
- Click to remove (Owners only)
- Enable reverse planning from goals backwards to current state
### Goal Paths (Amber Arrows)
**Goal paths represent your chosen route through the roadmap** - the specific sequence of milestones you've decided to focus on _right now_ to achieve your goals.
Think of your roadmap as a map showing many possible routes to your destination. Some paths are direct, others are scenic detours, and some are experiments you might explore later. **The goal path highlights which route you're actually taking.**
**Why Goal Paths Matter:**
Your roadmap can contain multiple options and ideas - not all of them need to align or happen. You might have:
- Experimental features you're considering
- Alternative approaches to the same problem
- Nice-to-have features for later
- Multiple ways to achieve a business outcome
**The goal path lets you say "this is what we're doing now" without deleting the other options.**
**Features:**
- Amber (orange) colored arrows to distinguish from regular dependencies
- Always animated to highlight your strategic focus
- Thicker than regular dependencies
- Filter the roadmap to show _only_ goal path work
- Multiple milestones can contribute to the same goal (parallel progress)
- Used to determine execution priority and forecasts
**Setting the Goal Path:**
When you mark a milestone as "on goal path" (`isOnGoalPath = true`):
1. It gets included in execution order calculations
2. It appears in schedule forecasts
3. It's prioritized for team assignment
4. It shows in the "Goal Path Only" filter
Milestones _not_ on the goal path remain visible but are deprioritized - they're possibilities, not commitments.
## Grid and Positioning
The roadmap uses a grid for consistent spacing. All nodes snap to the grid when dragged.
**Position Persistence**: When you drag a node to a new position, the coordinates are saved and persist across sessions.
## Editing and Permissions
### Owner Permissions
Only project **Owners** can edit the roadmap structure:
- Drag nodes to reposition them
- Create new milestones/goals by double-clicking empty space
- Connect nodes by dragging from connection handles
- Delete dependencies by clicking edges
- Create dependencies using the + buttons that appear on hover
### Viewer Permissions
Other roles (Collaborator, Stakeholder, Viewer) can:
- View the roadmap and all connections
- Click nodes to see details
- Use filters to focus on specific work
- Cannot drag, create, or modify structure
While Collaborators can create and edit milestones through other interfaces (like the backlog), they cannot modify the roadmap layout or connections. This ensures Owners maintain control over strategic planning.
## Interactive Features
### Creating Connections
**Drag from handles:**
1. Hover over a milestone/goal to see purple connection handles on left and right
2. Drag from the **source** (right handle) of the prerequisite
3. Drop on the **target** (left handle) of the dependent milestone
4. The connection is created immediately
**Using + buttons:**
1. Hover over a milestone to see + buttons on left and right
2. Click the **left** + button to create a new prerequisite
3. Click the **right** + button to create a new dependent milestone
4. A new node is created and automatically connected
### Creating New Nodes
**Double-click creation:**
1. Double-click empty space on the canvas
2. A dialog opens to configure the new milestone/goal
3. Choose type (Milestone or Goal), name, and description
4. The node is created at the clicked position (snapped to grid)
### Deleting Connections
**Click edges to delete:**
1. Click any dependency edge (arrow)
2. Confirm deletion in the dialog
3. The dependency is removed (does not delete the milestones)
### Filtering the View
**Goal Path Filter:**
- Toggle "Goal Path Only" to show only milestones that contribute to strategic goals
- Hides milestones not connected to goals via amber arrows
- Helps focus on strategic work vs exploratory/experimental work
**Status Filters:**
- "Exclude Done Milestones" hides completed work to declutter the view
- Status filters combine: you can show only in-progress work on the goal path
## Visual Legend
The roadmap includes a comprehensive legend showing:
**Status Colors:**
- Gray: Concept (early ideation, not planned)
- Purple: Planned (scheduled but not started)
- Blue: In Progress (actively being worked on)
- Green: Done (completed)
**Node Types:**
- Flag icon = Milestone (concrete deliverable)
- Target icon = Goal (strategic objective)
**Connection Types:**
- Amber animated arrow = Dependency on goal path (thicker)
- Purple solid arrow = Regular dependency (thinner)
**Usage Instructions:**
- Drag nodes to reposition (Owners only)
- Double-click empty space to create new nodes
- Connect nodes by dragging from handles
- Click edges to delete dependencies
## Use Cases
The roadmap is designed for a few core patterns. See [Goal Path Planning](/docs/features/goal-path-planning) for a full guide on methodology.
**Reverse planning**: Start with your goal, then work backwards asking "What must be done before this?" until you reach work you can start today. Mark that chain as your goal path.
**Managing alternatives**: Connect multiple milestones to the same goal. Put only your chosen approach on the goal path. Alternatives stay visible without cluttering your committed work.
**Strategic alignment**: Use goals to represent OKRs or initiatives. Connect milestones to show how tactical work serves strategy. The goal path shows your current focus, not every possibility.
**Dependency visibility**: Connect milestones to see what's blocking what. Combined with the goal path, this makes the critical path obvious at a glance.
## Best Practices
**1. Use goals sparingly**
- Create goals for significant business outcomes, not every feature
- Typical projects have 3-7 major goals
- Too many goals dilute focus
- Consider using Goal-type milestones as sub-goals for hierarchy
**2. Be intentional with the goal path**
- The goal path is your commitment, not your wishlist
- Only mark milestones as "on goal path" if you're actively pursuing them
- Keep alternatives visible but off the goal path
- Review and adjust the goal path as priorities change
**3. Use reverse planning**
- Start with the goal (outcome) and work backwards
- Ask "What must be done immediately before this?" for each step
- This ensures every milestone directly serves the goal
- Creates clearer dependencies and reduces scope creep
**4. Minimize dependency complexity**
- Keep the graph as simple as possible
- Long dependency chains increase risk and forecast uncertainty
- Parallel work is better than sequential when possible
- Use dependencies to capture true prerequisites, not nice-to-haves
**5. Use spatial layout meaningfully**
- Position goals at strategic locations (often top-right as "north star")
- Flow dependencies left-to-right (past → future) or bottom-to-top (foundation → goal)
- Group related milestones visually
- Use the grid to create clear rows or columns
- Reverse planning often creates vertical or diagonal chains toward goals
**6. Use filters strategically**
- Use "Goal Path Only" during strategic reviews and planning sessions
- Use "Exclude Done" to focus on current/future work
- Combine filters to create different views for different audiences
- Full roadmap view (no filters) shows all possibilities and context
- Goal path view shows commitments and priorities
## FAQ
**Q: What's the difference between a dependency and being on the goal path?**
A: Dependencies are prerequisite relationships ("A must finish before B starts"). The goal path is your chosen strategy ("these are the milestones we're focusing on now"). A milestone can have dependencies without being on the goal path. See [Goal Path Planning](/docs/features/goal-path-planning) for more on when and how to use each.
**Q: Can I create circular dependencies?**
A: No, the system prevents circular dependencies. You cannot create a dependency that would form a loop (e.g., A depends on B, B depends on C, C depends on A).
**Q: What happens if I delete a milestone that has dependencies?**
A: Deleting a milestone removes all its dependencies. Dependent milestones become unblocked, and prerequisites lose their connection.
**Q: Can milestones contribute to multiple goals?**
A: Yes. You can connect a milestone to multiple goals via dependencies. The roadmap visualizes all these connections, making it easy to see how work contributes to different objectives.
**Q: How do forecasts use the roadmap data?**
A: Forecasts traverse dependency chains to calculate cumulative duration. **Only milestones on the goal path** are included in execution order calculations and delivery forecasts. Off-path milestones are visible but not scheduled. See [Understanding Project Forecasts](/docs/features/velocity-tracking) for details.
**Q: Can Collaborators see the roadmap?**
A: Yes, all roles can view the roadmap. Only Owners can edit structure and positioning.
**Q: Does the roadmap work on mobile?**
A: The roadmap is optimized for desktop/tablet use. On mobile, you can view and navigate but editing is limited by screen size and touch precision.
---
#### Delivery Insights
# Your delivery coach, available at the click of a button
Hiring an experienced agile coach costs $200/hour. Reading up on Kanban flow metrics, Little's Law, and Monte Carlo forecasting takes months. And even then, someone still has to pull the data, interpret it, and tell you what it means for *your* project.
GoalPath Insights puts that expertise at your fingertips. It knows the frameworks, has all your metrics, and combines them to answer the questions every project lead asks: *Can we go faster? What's slowing us down? Are we working on the right things?*
## How it works
1. **Go to Insights** in the sidebar
2. **Pick a question** from the categorized list
3. **Get an actionable answer** with data signals and concrete suggestions
Every answer includes:
- **Data signals**: the specific evidence behind the answer (e.g., "items take 8 days on average", "12 items in progress")
- **Suggestions**: 2-4 options framed as trade-offs, not mandates
- **Confidence level**: how much data supports the insight
## Questions you can ask
### Speed & Throughput
- Can we go faster?
- What is slowing us down right now?
- Is our current pace sustainable?
- Are we doing too much at the same time?
### Focus & Prioritization
- Are we working on the most important things?
- How much work is planned vs. unplanned?
- Is new work interrupting delivery?
### Predictability & Forecasting
- How reliable are our current delivery estimates?
- Why did forecasts change recently?
- What makes upcoming delivery less predictable?
### Flow & WIP
- Do we have too much work in progress?
- Where is work getting stuck?
- Are blockers affecting overall progress or just individual items?
- How efficient is our delivery process?
### Team & Execution
- Is work spread evenly or concentrated?
- Are multiple tracks affecting predictability?
- Does the current setup match the team size?
## Like having an expert on the team
Most teams don't need a full-time agile coach. They need someone who can look at their data once a week and say "here's what's actually going on, and here are your options."
That's what Insights does. It combines delivery frameworks (flow metrics, WIP analysis, velocity trends, forecast modeling) with your project's real numbers and gives you the interpretation a seasoned coach would.
**It doesn't just show charts.** It tells you what the charts mean for your project, right now.
**It doesn't guess.** Every answer is grounded in your actual velocity, delivery speed, work-in-progress, and completion rates.
**It doesn't prescribe.** Suggestions come as trade-offs, not mandates. Your team knows your context; Insights gives you the analysis and you make the call.
## What GoalPath measures
Insights draws from four areas of your project's health, all computed automatically from how your team uses GoalPath. No extra setup.
### How fast work moves
How long does it take from request to delivery? GoalPath tracks total time, active work time, and wait time separately, so you can see whether the bottleneck is capacity or process. Faster delivery shows up as lower numbers. A big gap between total time and active time means work is sitting idle.
### How efficiently time is spent
What percentage of a work item's lifecycle is active work vs. waiting? Most teams spend 75-85% of the time waiting. Knowing your ratio tells you whether to focus on doing the work faster or starting it sooner.
### What the team is working on
What's the balance between new features, bug fixes, and technical tasks? If bugs are consuming a third of your capacity, that's worth knowing before the board asks.
### How much is in flight
How many items are in progress, and how long have they been there? Work that's been active for 30+ days is almost always stuck. High work-in-progress with aging items is the most reliable predictor of delivery problems.
## Milestone health indicators
GoalPath watches every in-progress milestone and flags when something looks off. The health indicator shows up on your roadmap and in weekly progress reports.
- **Healthy** (green): On track. Nothing flagged.
- **At Risk** (yellow): Emerging concerns worth investigating.
- **Critical** (red): Multiple warning signs. Needs attention now.
- **Stale** (gray): Marked as in-progress but nothing is happening. Still active?
The score considers velocity trends, blocked items, whether you're on pace to finish, how recently work happened, and whether scope has grown since the milestone started.
## Getting started
Insights is available on the **Teams & Insights** plan. Navigate to **Insights** in the sidebar to start asking questions.
No configuration needed. It works with whatever data your project already has. The more work your team moves through GoalPath, the sharper the insights become.
---
#### Goal Path Planning
# Goal Path Planning
Roadmaps fail when they try to show everything without distinguishing what matters. Goal path planning starts with the outcome you're committed to and works backwards: every milestone either leads to the goal or it doesn't, and the roadmap makes that distinction visible.
**The core idea**: Not all work on a roadmap has the same weight. Goal paths separate commitments from explorations, so your team knows exactly what to protect when resources are tight.
## How Goal Paths Work
A goal path is a highlighted chain of dependencies from your current work to a business goal. On the [visual roadmap](/docs/features/visual-roadmap), goal path dependencies appear as **amber animated arrows** (thicker than regular purple dependency arrows).
When you mark a dependency as "on goal path":
- It appears in execution order calculations and delivery [forecasts](/docs/features/velocity-tracking)
- It's prioritized for team assignment
- It shows in the "On GoalPath only" filter
- It's highlighted in [automatic progress reports](/docs/features/automated-weekly-updates)
Milestones not on the goal path remain visible but are deprioritized. They're possibilities, not commitments.
## Reverse Planning: Start with the Outcome
Instead of planning forward from where you are, start with where you need to be.
### Step by step
1. **Create a Goal** representing your desired business outcome (e.g., "Enterprise-Ready Product")
2. **Ask**: "What milestone must be completed right before this goal?"
3. **Create that milestone** and connect it to the goal with a dependency
4. **Repeat** for each milestone: "What must be done before this?"
5. **Mark the chain** as "on goal path" to prioritize it
This creates a dependency chain from your current state to your goal:
```
Goal: "Enterprise-Ready Product"
↑ (depends on)
Milestone: "SOC 2 Compliance Achieved"
↑ (depends on)
Milestone: "Audit Controls Implemented"
↑ (depends on)
Milestone: "Security Logging Complete"
↑ (depends on)
Milestone: "Audit Infrastructure" ← start here
```
Every milestone justifies its existence by answering: "Does this need to happen before we reach the goal?"
### Why reverse planning works
When you plan forward, scope creeps in quietly (each addition seems small). When you plan backwards from a goal, the roadmap becomes a constraint. Work that doesn't serve the goal is visible as off-path, making it easier to defer or cut.
## Commitments vs. Explorations
Real projects involve alternatives and experimentation. Your roadmap should capture possibilities without committing to all of them.
### Example: Exploring two approaches
```
Goal: "Improve User Onboarding"
↑ (two possible approaches)
├─ Milestone: "Interactive Tutorial" (NOT on goal path, exploring)
└─ Milestone: "Guided Checklist" (ON goal path, chosen approach)
```
Both milestones connect to the goal, but only "Guided Checklist" is on the goal path. The tutorial stays visible as a backup if the checklist doesn't work out.
**Benefits of this pattern:**
- Preserve context about decisions not taken
- Pivot quickly if the initial approach fails
- Filter to "On GoalPath only" to see committed work
- Stakeholders see what you're pursuing vs. what you're considering
## Goals with Forecasts
Each goal on the roadmap has a [delivery forecast](/docs/features/velocity-tracking) based on the work that leads to it. The forecast follows the dependency chain:
- Add scope to a goal path → the forecast extends
- A prerequisite falls behind → the goal's expected date shifts
- Complete work ahead of schedule → the forecast tightens
You see the impact of scope decisions before you make them, not after the deadline passes.
**Only goal path milestones are included in execution order calculations and forecasts.** Off-path milestones are visible on the roadmap but not scheduled. This keeps forecasts focused on committed work.
## Using Goal Paths in Practice
### Strategic planning
Use goals to represent quarterly OKRs or business initiatives. Connect the milestones that contribute to each goal. The goal path shows which connections you're actively pursuing: your current strategy, not all possible strategies.
### Multi-team coordination
When multiple teams contribute to a shared goal, the roadmap shows how their work converges. All teams can see which of their milestones are on the critical path vs. exploratory work.
### Trade-off conversations
When stakeholders can see what's on the goal path and what isn't, the conversation shifts from "can we add this?" to "what does adding this do to our timeline?" Goal paths make trade-offs visual, so decisions happen with full context.
### Sub-goals
Large goals can be broken into smaller sub-goals. Create a new goal for each sub-goal, then connect milestones to those sub-goals instead of directly to the top-level goal. This creates a hierarchy: strategic goals → tactical sub-goals → concrete milestones.
## Best Practices
1. **Be intentional with the goal path.** Only mark milestones as "on goal path" if you're actively committed to them. Keep alternatives visible but off-path.
2. **Use goals sparingly.** Create goals for significant business outcomes, not every feature. Typical projects have 3-7 major goals.
3. **Review regularly.** As priorities change, update the goal path. Move milestones on or off the path as your strategy evolves.
4. **Keep dependency chains short.** Long chains increase risk and forecast uncertainty. Parallel work is better than sequential when possible.
5. **Use spatial layout meaningfully.** Position goals as a "north star" (often top-right). Flow dependencies left-to-right (past → future). This makes the path visually intuitive.
## FAQ
**Q: What's the difference between a dependency and being on the goal path?**
A: Dependencies are prerequisite relationships ("A must finish before B starts"). The goal path is your chosen strategy ("these are the milestones we're focusing on now"). A milestone can have dependencies without being on the goal path. It might be an alternative approach you're keeping as a backup.
**Q: Can I have multiple goal paths?**
A: There's one goal path per project. You can have parallel branches on that path, with multiple milestones contributing to the same goal. For separate initiatives, use different projects.
**Q: Should everything on the roadmap be on the goal path?**
A: No. The roadmap should contain explorations, alternatives, and "someday maybe" ideas. Only milestones you're actively committed to should be on the goal path. This keeps your strategy clear while preserving context about other options.
**Q: Can milestones contribute to multiple goals?**
A: Yes. You can connect a milestone to multiple goals via dependencies. The roadmap visualizes all these connections, making it easy to see how work contributes to different objectives.
**Q: How do I set a milestone as "on goal path"?**
A: When creating or editing a dependency between milestones, toggle the "on goal path" option. This highlights the dependency as an amber animated arrow on the roadmap.
---
#### PowerPoint Roadmap Export
# Stop building board decks by hand
Every quarter, someone spends a day pulling numbers from tickets, writing milestone summaries from memory, and dragging boxes around in PowerPoint. By the time the deck is done, half the data is already stale.
GoalPath builds the entire presentation from your live project data. One click, and you have a polished `.pptx` ready to present: milestones, Gantt timelines, dependency diagrams, forecasts, and narratives written in the language your board expects.
**From a day of work to under a minute.** The deck is always current because it pulls from live data, not from what someone remembered to type.
## How it works
1. Open the **Planning** page
2. Click **Export** in the toolbar
3. Pick your theme, timeframe, and whether to include narratives
4. Click **Export** and the `.pptx` downloads to your computer
The export runs entirely in your browser. No data leaves your machine except the API calls that already power the app.
## What's in the deck
### Title slide
Opens with your project name, a summary of active milestones, and today's date. Sets the stage without any setup work.
### Roadmap overview: Now / Next / Later
Milestones laid out in three columns so anyone can see what's happening, what's coming, and what's further out. Each card shows the name, status, and forecast date.
If your project uses the **Teams add-on**, milestones are grouped into swimlanes by team, so your board sees who owns what.
### Gantt timeline
A horizontal timeline showing milestones as colored bars across months. Each bar spans from start date to forecast completion, color-coded by status.
For projects with more than 12 milestones, the Gantt automatically splits across multiple slides so nothing gets compressed into unreadable slivers.
### One slide per milestone
Each milestone gets its own detail slide with:
- A **narrative** explaining what was accomplished, what's ahead, and what risks exist, written in board-friendly language
- A **progress bar** showing completion percentage
- **Forecast dates**: best case, expected, and risk-adjusted
- The **top items** so stakeholders can see what's actually in flight
Milestones are ordered by status: in progress first, then planned, then concepts.
### Dependency diagrams
Two views of how your milestones connect:
1. **Shape-based diagram**: a structured graph showing prerequisite and enables relationships, with the critical path highlighted
2. **Mermaid flowchart**: a rendered diagram with status-colored nodes and directional edges, generated from your dependency data
Both render automatically when your project has dependencies defined.
### Team overview
When the Teams add-on is active, a dedicated slide shows each team with their member count and active milestones. Useful when your board wants to understand team structure at a glance.
### Closing slide
A clean wrap-up with your project name and contact prompt.
## Narratives that speak your board's language
This is where the export saves the most time.
Instead of copying ticket titles into a slide and hoping stakeholders can decode them, GoalPath translates your execution data into concise, outcome-focused language. It draws from your weekly progress reports, milestone summaries, and delivery health metrics.
What your team sees: *"Item velocity trending up, 3 blockers resolved, cycle time down 15%."*
What your board sees: *"The team is shipping faster than last quarter. Three issues that were slowing delivery have been resolved."*
If you've configured your project's language to Swedish, German, French, or any of the supported languages, the narratives and all slide labels follow suit.
**Always works.** If the narrative service is temporarily unavailable, slides fall back to a progress summary with item counts. The export never fails.
## Make it yours
| Option | Default | What it does |
|--------|---------|-------------|
| **Theme** | Light | Light for printed decks. Dark for screen presentations. |
| **Timeframe** | 12 months | Only includes milestones with activity or forecasts within this window. |
## Who can export
Anyone with **Owner**, **Project Leader**, or **Collaborator** access. Stakeholders and Viewers don't see the button.
## Tips from teams using this
- **Keep it under 15 milestones.** That gives you a focused deck that holds attention. Use the timeframe filter to narrow the scope.
- **Use Dark theme when presenting on screen.** It reads better on projectors and in video calls.
- **Review the narratives before you present.** They're a strong first draft, not a final script. Open the file in PowerPoint and adjust the tone to match your voice.
- **Export right before the meeting.** The deck pulls from live data, so a fresh export is always up to date.
---
#### Browser Extension
# Report bugs from the page where you found them
When someone spots a bug, the last thing they should do is switch to another tab, try to remember the URL, type up what happened, and hope someone understands. By the time they finish, half the context is gone.
GoalPath's browser extension captures everything in one click (screenshot, page URL, browser info, console errors) and packages it into a GoalPath item. No tab-switching, no copy-pasting, no lost context.
## Install
- [Chrome Web Store](https://chromewebstore.google.com/detail/goalpath-bug-reporter-fee/giojefeaofcahpfcoeneloohdicmgnkj)
- Firefox and Edge: install from the Chrome Web Store using your browser's extension compatibility mode
## How it works
1. **Click the extension icon** (or right-click and select "Report issue to GoalPath")
2. **Choose Bug or Idea**: sets the item type in GoalPath
3. **Describe what happened**: what went wrong, what you expected
4. **Add a screenshot** (optional): captures the visible viewport, then draw a highlight rectangle over the problem area
5. **Submit**: the report lands in your project as a formatted item
The whole flow takes about 15 seconds.
## What gets captured automatically
When you open the extension, it collects context from the current page:
- **URL**: full page address including route and query parameters
- **Browser and OS**: version and platform
- **Viewport size**: screen dimensions at the time of capture
- **Environment**: detects production, staging, or localhost
- **Console errors**: JavaScript errors logged at the time of capture
- **Failed network requests**: API calls that returned errors
- **Timestamp**: when the report was captured
All captured data is visible and editable before submission. You can remove any field you don't want to include.
## Screenshots and highlighting
Click "Add screenshot" to capture the visible viewport. After capture:
- **Draw a highlight rectangle** over the problem area
- **Add redaction boxes** to cover sensitive information
- **Remove the screenshot** entirely if you change your mind
A reminder is shown when you capture a screenshot: make sure no sensitive information is visible.
## Targeting a milestone
By default, reports go to the project inbox. If you're testing a specific milestone, you can select it from the dropdown. The extension remembers your selection for quick follow-up reports.
This is useful during focused testing sessions where you want all findings grouped in one place.
## Multi-project support
If you belong to multiple GoalPath projects, the extension lets you pick which one to report to. Your selection is remembered until you change it.
## What happens after submission
Each report becomes a GoalPath item with:
- A clear title based on your description
- The full description formatted in markdown
- Screenshot with highlights embedded
- Browser context in a structured format
- Item type set to Bug or Feature based on your classification
From there, it follows the same workflow as any other item: triage, prioritize, assign, track.
## Privacy
The extension captures only what you explicitly trigger. It does not:
- Run in the background
- Capture screenshots automatically
- Send data without your review and confirmation
- Access cookies, auth headers, or form input values
You can review and edit everything before submitting. Minimal browser permissions are requested.
## Who can use it
Anyone who is a member of a GoalPath project can install the extension and report to that project. No special permissions needed beyond project membership. Viewers cannot submit reports.
---
#### Git Integration
# Git Integration: From Commit to Delivery Insight
GoalPath connects to your git provider to close the loop between code and project management. Tag a commit with `#GP-47`, and GoalPath updates the item, measures your deployment performance, and feeds the data into your delivery forecasts and progress reports.
This guide covers everything: how to set it up, how linking works, what DORA metrics you get, and how the data flows into the rest of GoalPath.
## The Short Version
- **Tag commits and PRs with `#GP-47`** (the item's short number). GoalPath links the code activity to the item.
- **PRs drive item status**: opened = Started, merged = Finished. No manual board updates.
- **DORA metrics appear automatically**: deployment frequency, lead time, change failure rate, MTTR.
- **AI fills gaps**: forget the tag, and GoalPath suggests matches from commit message similarity.
- **Works with GitHub, GitLab, and Bitbucket.** The core engine is provider-neutral.
---
## Setup
### Step 1: Connect your git provider
Navigate to **Settings > Integrations** in your GoalPath project. You will see cards for GitHub, GitLab, and Bitbucket. Click "Connect" on your provider.
GoalPath requests read-only access to your repositories and issues. It never writes to your git provider.
| Provider | OAuth scopes requested |
|----------|----------------------|
| GitHub | `repo`, `read:org` |
| GitLab | `read_api`, `read_repository`, `read_user` |
| Bitbucket | `repository`, `pullrequest`, `issue` |
### Step 2: Register a repository
After connecting, click "Register Repository" and enter the full repository name (e.g., `myorg/myrepo`). GoalPath generates a unique webhook secret for HMAC signature verification.
You can register multiple repositories per project. Each repository has independent settings for auto-status and AI matching.
### Step 3: Add the webhook
In your git provider's repository settings, create a webhook:
| Setting | Value |
|---------|-------|
| **URL** | `https://goalpath.app/api/webhooks/github` (or `/gitlab` or `/bitbucket`) |
| **Secret** | The webhook secret shown in GoalPath after registration |
| **Content type** | `application/json` |
| **Events** | Pushes, Pull Requests (or Merge Requests), Releases, Deployments |
GoalPath validates every incoming webhook using HMAC-SHA256 (GitHub, Bitbucket) or secret token comparison (GitLab). Invalid payloads are rejected with 401.
### Step 4: Start tagging
Every item in GoalPath has a sequential short number displayed as `#GP-N`. You will see it on kanban cards, in item details, and in search results.
Include the tag in your workflow:
**Commit messages:**
```
git commit -m "Fix auth redirect loop #GP-47"
```
**Branch names:**
```
git checkout -b feature/GP-47-auth-redirect
```
**PR titles:**
```
Fix auth redirect loop #GP-47
```
The tag is case-insensitive. `#gp-47` and `#GP-47` both work. Multiple references are supported: `"Fix #GP-47 and #GP-48"` links to both items.
---
## How Linking Works
When GoalPath receives a webhook event, it scans commit messages, PR titles/bodies, and branch names for `#GP-N` patterns. Each match creates a **GitCommitLink** record that associates the commit with the item.
### Confidence Levels
Not all links are created equal. GoalPath assigns a confidence score to each link based on how it was detected:
| Source | Confidence | Example | Triggers auto-status? |
|--------|-----------|---------|----------------------|
| `#GP-N` in commit message | 100% | `"Fix login #GP-47"` | Yes |
| `#GP-N` in PR title or body | 100% | PR title: `"Auth fix #GP-47"` | Yes |
| Branch name pattern | 95% | `feature/GP-47-auth` | No |
| Commit in a linked PR | 90% | Commit in PR that references #GP-47 | No |
| AI vector similarity | 60-90% | Semantically similar message | No |
| Time + author heuristic | 40-50% | Owner's commit during active period | No |
**Only 100% confidence links trigger automatic status changes.** All other links appear as suggestions that you can confirm or dismiss.
### The Code Activity Panel
Each item has a "Code Activity" section in its detail view. This shows:
- **Confirmed commits** (green): 100% confidence or manually confirmed. Shows SHA, message, author, and timestamp.
- **Suggested commits** (amber): Below 100% confidence. Shows confidence badge and source label. One-click confirm or dismiss.
- **PR activity**: linked PRs with state badges (open, merged, closed) and line change counts.
Confirming a suggestion promotes it to 100% confidence. Dismissing removes it and improves future AI matching.
---
## Automatic Status Updates
When a PR linked to an item changes state, GoalPath can update the item's status automatically.
| PR event | Item status change |
|----------|-------------------|
| PR opened (references `#GP-N`) | NotStarted -> Started |
| PR merged | Any -> Finished |
| PR closed without merge | No change |
### Rules and safeguards
- **Only explicit references trigger status changes.** Suggested links (AI, branch, heuristic) never move items. This prevents false positives from affecting your board.
- **Manual overrides always win.** If someone manually sets an item to a specific status, GoalPath will not override it.
- **Auto-status is per-repository.** Toggle it in Settings > Integrations for each connected repository.
### Why "Finished" and not "Delivered"?
GoalPath's item lifecycle is: NotStarted -> Started -> Finished -> Delivered. A merged PR means the code is done, but it may not be deployed or verified yet. "Finished" means ready for stakeholder review. "Delivered" is a separate step that acknowledges the work has been accepted.
---
## DORA Metrics
DORA (DevOps Research and Assessment) defines four metrics that predict software delivery performance. GoalPath computes all four from your deployment data.
### Deployment Frequency
How often code reaches production. GoalPath counts production deployments per week and classifies against industry benchmarks:
| Level | Threshold | What it means |
|-------|-----------|---------------|
| **Elite** | 7+ deploys/week | Multiple deploys per day. Continuous delivery. |
| **High** | 1-7 deploys/week | At least daily. Strong deployment pipeline. |
| **Medium** | 0.25-1 deploys/week | Weekly to monthly. Typical for teams with manual release processes. |
| **Low** | < 0.25/week | Less than monthly. Significant deployment friction. |
### Lead Time for Changes
Time from first commit to production deployment, measured in hours. GoalPath matches the deployed commit SHA against stored commit timestamps. The metric uses the median across all deployments in the measurement period (default: 12 weeks).
A long lead time often indicates:
- Slow code review processes
- Manual QA gates
- Deployment queue bottlenecks
- Large batch releases (many changes bundled into one deploy)
### Change Failure Rate
Percentage of deployments that are followed by another deployment within a configurable window (default: 4 hours). The assumption: a rapid follow-up deployment indicates the first one caused a problem that needed fixing.
This is a heuristic approximation. It works well for teams that deploy a few times per week. For teams deploying many times per day, the heuristic may over-count failures since back-to-back deployments are normal workflow. GoalPath notes this limitation in the metrics display.
### Mean Time to Recovery (MTTR)
Median hours between a "failed" deployment (one followed by a quick fix) and the next successful deployment. Lower MTTR means your team recovers from problems faster.
### DORA Level
GoalPath assigns an overall DORA level based on the worst metric across all four:
| Level | Criteria |
|-------|----------|
| **Elite** | Frequency >= 7/week AND lead time < 24h AND failure rate < 15% AND MTTR < 1h |
| **High** | Frequency >= 1/week AND lead time < 168h AND failure rate < 30% AND MTTR < 24h |
| **Medium** | Frequency >= 0.25/week AND lead time < 720h AND failure rate < 45% AND MTTR < 168h |
| **Low** | Anything else |
### Configuration
In **Settings > Integrations > DORA Configuration**:
- **Deployment source**: Choose between GitHub Releases or the Deployment API. Some teams create releases to mark production deploys. Others use GitHub's deployment environment system. Pick whichever matches your workflow.
- **Production environment**: When using the Deployment API, GoalPath filters to this environment name (default: "production"). Staging and preview deployments are excluded.
- **Change failure window**: Hours within which a follow-up deployment counts as a failure indicator (default: 4 hours).
### Backfill
When you first connect a repository, GoalPath imports the last 90 days of releases from your git provider and computes initial DORA metrics. After that, metrics update automatically as new webhook events arrive.
---
## AI Commit Matching
Not every developer will remember to tag every commit. GoalPath uses two strategies to suggest links for untagged commits.
### Vector Similarity
GoalPath already maintains vector embeddings for all item titles and descriptions (used for search and duplicate detection). When an untagged commit arrives:
1. The commit message is embedded using the same model (OpenAI text-embedding-3-small, 1536 dimensions)
2. GoalPath queries pgvector for items with similar embeddings, filtered to items that are currently Started or were started within the last 90 days
3. Matches above the confidence threshold (default: 0.6) become suggested links
The confidence score is the cosine similarity between the commit message embedding and the item embedding, with boosters:
- **+0.1** if the commit author's email matches the item owner's email
- **+0.05** if the commit falls within the item's active period (started within the last 2 weeks)
- **Capped at 0.95** (only explicit `#GP-N` references reach 1.0)
### Time + Author Heuristic
A simpler fallback: if a commit's author email matches the owner of a Started item, GoalPath creates a low-confidence suggestion (0.4-0.5). This catches cases where the commit message is too terse for meaningful vector similarity.
### Managing Suggestions
Suggested links appear in the item's Code Activity panel with their confidence score and source. You have two options:
- **Confirm**: Promotes the link to 100% confidence. The commit is now fully linked to the item.
- **Dismiss**: Removes the suggestion. Dismissed links are not recreated by future webhook events.
Both actions improve future matching. Over time, GoalPath learns your team's patterns.
### Configuration
- **Toggle AI matching** per repository in Settings > Integrations
- **Set confidence threshold** (0.3 to 0.9, default 0.6). Higher = fewer suggestions but higher quality. Lower = more suggestions but more noise.
---
## Importing Existing Issues
If your team already tracks issues in GitHub, GitLab, or Bitbucket, you can import them into GoalPath instead of re-entering everything manually.
### The import wizard
Available from **Settings > Integrations** or during **onboarding** (the "Break It Down" phase):
1. **Connect**: Authorize GoalPath with your git provider
2. **Select repository**: Choose which repo to import from. See issue counts per repo.
3. **Preview and map**: Before importing, configure how issues translate to GoalPath items:
- **Labels -> Item types**: Map "bug" to Bug, "enhancement" to Feature, etc. Smart defaults provided.
- **Milestones -> GoalPath milestones**: Map each git milestone to an existing GoalPath milestone or create a new one.
- **Assignees -> Owners**: GoalPath matches assignees by name/email. Unmatched users are skipped.
- **Options**: Include or exclude closed issues.
4. **Import**: One click creates all mapped items. Each item stores the original issue URL in metadata for reference.
### Idempotent imports
The import is safe to run multiple times. GoalPath tracks which issues have already been imported (by issue number and repository) and skips duplicates. This means you can re-import after adding new issues to catch up without creating duplicates.
---
## How DORA Data Enriches GoalPath
The git integration is not a standalone dashboard. DORA data flows into GoalPath's existing systems:
### Delivery Forecasts
GoalPath's Monte Carlo forecasting already uses team velocity to predict delivery dates. DORA data adds deployment reality:
- **Change failure rate above 30%**: The pessimistic forecast estimate widens to account for rework from failed deployments. If 40% of your deploys need a follow-up fix, your effective throughput is lower than raw velocity suggests.
- **Deploy lead time**: Added as a buffer between "code complete" and "in production." If your median deploy lead time is 48 hours, the forecast adds 2 days to the delivery date.
- **Dropping deployment frequency**: If deploys per week drop below 0.5, GoalPath flags velocity data as potentially stale. Teams that stop deploying may not be completing work even if items are marked Finished.
### Progress Reports
Automated weekly progress reports include code activity when available:
- Commits linked to items are referenced in milestone progress summaries
- DORA trend changes (e.g., deployment frequency dropped from High to Medium) are flagged
### Delivery Insights
The insights engine gains four DORA-related questions:
- "How often are we deploying?"
- "What's our lead time from code to production?"
- "Are our deployments reliable?"
- "How quickly do we recover from failures?"
These are answered from real data, not generic advice.
---
## Provider Comparison
| Capability | GitHub | GitLab | Bitbucket |
|-----------|--------|--------|-----------|
| OAuth connection | Yes | Yes | Yes |
| Issue import | Yes | Yes | Yes |
| Push webhook | Yes | Yes | Yes |
| PR/MR webhook | Pull Requests | Merge Requests | Pull Requests |
| Release webhook | Yes | Yes | N/A (use tags) |
| Deployment webhook | Yes | Yes | Limited |
| DORA: Releases | Yes | Yes | Use Deployment API |
| DORA: Deployment API | Yes | Yes | Via commit statuses |
| Webhook auth | HMAC-SHA256 | Secret token | HMAC-SHA256 |
All three providers feed into the same GoalPath engine. Commits, links, DORA metrics, and forecasts work identically regardless of which provider hosts your code.
---
## Troubleshooting
**Items don't link to commits:**
- Verify the webhook is configured in your git provider's repository settings
- Check that the webhook URL matches your provider (`/github`, `/gitlab`, or `/bitbucket`)
- Confirm the webhook secret matches what GoalPath generated
- Make sure the tag format is correct: `#GP-47` (not `#47` or `GP47`)
**Auto-status not updating:**
- Check that auto-status is enabled for the repository in Settings > Integrations
- Only `#GP-N` references (100% confidence) trigger status changes. Branch-name and AI matches do not.
- Manual status overrides prevent auto-updates. If someone manually changed the status after the PR was opened, GoalPath respects the manual choice.
**DORA metrics show 0 or are missing:**
- DORA requires at least one deployment or release event. If your team doesn't use GitHub Releases or the Deployment API, DORA metrics won't populate.
- Check the deployment source setting (Releases vs Deployment API) in DORA Configuration
- The initial backfill imports the last 90 days of releases. If your repo has no releases in that window, metrics start from the first new webhook event.
**AI suggestions are too noisy or too sparse:**
- Adjust the confidence threshold in Settings > Integrations. Higher (0.8) = fewer, more accurate suggestions. Lower (0.4) = more suggestions, more noise.
- Make sure items have descriptive titles and descriptions. The AI matches against item embeddings, so vague titles produce vague matches.
---
### Integrations
#### MCP Server & CLI
# MCP Server & CLI
GoalPath speaks [MCP](https://modelcontextprotocol.io/) (Model Context Protocol), the open standard for connecting AI assistants to external tools. Once connected, your assistant can see what's assigned, update item status, check off subtasks, post progress notes, and ask questions about your project's health. No tab-switching or copy-pasting item IDs required.
There are two ways to connect: a **hosted server** (recommended for most setups) and a **local CLI**. Both expose the same 38 tools. The difference is how they connect and how they resolve which project you're working on.
## Hosted MCP server (recommended)
The fastest way to connect. No install, no API key, no config files.
**Endpoint:**
```
https://goalpath.app/api/mcp
```
This works with any AI tool that supports remote MCP servers, including Claude Desktop, Claude Code, Claude.ai, Claude mobile, Cursor, VS Code Copilot, and Windsurf.
Because it's built on the open MCP spec, it will also work with future AI tools from other providers as they add remote MCP support.
### Setup: Claude Desktop
1. Go to **Settings > Connectors > Add URL**
2. Paste `https://goalpath.app/api/mcp`
3. Claude opens a browser window. Log in to GoalPath and click **Allow**.
That's it. Your assistant now has access to your GoalPath projects. The OAuth token refreshes automatically, so you only authenticate once.
### Setup: Claude Code
```bash
claude mcp add goalpath-remote --url https://goalpath.app/api/mcp
```
Claude Code will prompt you to authenticate via browser the first time.
### Setup: Cursor / VS Code / Windsurf
Add this to your MCP configuration (check your tool's docs for the config file location):
```json
{
"mcpServers": {
"goalpath": {
"url": "https://goalpath.app/api/mcp"
}
}
}
```
Your tool will handle the OAuth flow when it first connects.
### Setup: API key (any client)
If your MCP client doesn't support OAuth, generate an API key at **Profile > API Keys** ([goalpath.app/profile/api-keys](https://goalpath.app/profile/api-keys)) and pass it as a Bearer token:
```
Authorization: Bearer gp_xxxxx
```
### Setup: Codex
Codex connects to remote MCP servers directly over HTTP with a bearer token. No CLI or stdio relay needed.
First, generate an API key at **Profile > API Keys** ([goalpath.app/profile/api-keys](https://goalpath.app/profile/api-keys)), then set it as an environment variable in whatever shell/environment Codex runs from:
```bash
export GOALPATH_API_KEY=gp_xxxxx
```
**Codex CLI**: add to `~/.codex/config.toml` (or a project-scoped `.codex/config.toml`):
```toml
[mcp_servers.goalpath]
url = "https://goalpath.app/api/mcp"
bearer_token_env_var = "GOALPATH_API_KEY"
```
**Codex app / IDE extension**: in the "Add MCP server" dialog, choose the remote/HTTP server type and fill in:
| Field | Value |
|---|---|
| URL | `https://goalpath.app/api/mcp` |
| Bearer token env var | `GOALPATH_API_KEY` |
Start (or restart) a Codex session and run `/mcp` to confirm GoalPath shows up as connected with its tools listed.
### How the hosted server picks your project
Without a local `.goalpath` file, the hosted server needs another way to know which project you're working on. It uses this priority:
1. **Explicit `projectId`** in the tool call (your assistant can pass this directly)
2. **Active project** set via the `set_active_project` tool (persists across requests)
3. **Most recently used project** from your account (automatic fallback)
If you work on a single project, you'll never think about this. If you work on multiple, your assistant will call `list_projects` and `set_active_project` when it's unclear which one you mean.
## Local CLI
The CLI gives you two things the hosted server can't: **automatic project resolution from your repo** and **terminal commands** for quick lookups without an AI assistant.
Install it if you want your AI assistant to automatically know which project a codebase belongs to, or if you prefer terminal access to GoalPath.
### Install
```bash
npm install -g @goalpath/cli
```
### Authenticate
```bash
goalpath login
```
Paste your API key when prompted. Generate one at **Profile > API Keys** in GoalPath, or go directly to [goalpath.app/profile/api-keys](https://goalpath.app/profile/api-keys).
For CI or scripted setups: `goalpath login --api-key gp_xxxxx`
### Link your repository
```bash
goalpath project link
```
This creates a `.goalpath` file in your repo root. Commit it. When your teammates clone the repo, their CLI and AI assistant will automatically know which GoalPath project this codebase belongs to. No `set_active_project` call needed.
If you work on multiple projects, override the linked project with the `GOALPATH_PROJECT_ID` environment variable.
### Connect your AI assistant
```bash
goalpath mcp init
```
Auto-detects Claude Code, Claude Desktop, Cursor, and VS Code. Adds GoalPath to their MCP configuration without overwriting anything.
Target a specific tool:
```bash
goalpath mcp init claude-desktop
goalpath mcp init cursor
goalpath mcp init vscode
```
Manual config: add this to your tool's MCP config file (`.mcp.json` for Claude Code, `claude_desktop_config.json` for Claude Desktop):
```json
{
"mcpServers": {
"goalpath": {
"command": "goalpath",
"args": ["mcp", "serve"]
}
}
}
```
### CLI commands
For quick terminal access without an AI assistant:
```bash
goalpath items --mine # Your assigned items
goalpath items --status Started # Filter by status
goalpath items --milestone "v2.1" # Filter by milestone
goalpath status # Project summary
goalpath project list # All your projects
```
## Which should I use?
**Use the hosted server** if you want the simplest setup, connect from mobile or browser, or use a tool that supports remote MCP.
**Use the CLI** if you want automatic project resolution from `.goalpath` files committed to your repos, or if your AI tool only supports stdio-based MCP servers.
**Use both** if you want the CLI's repo-aware project resolution in your coding tool and the hosted server for Claude Desktop, mobile, or browser access. They don't conflict.
| | Hosted server | Local CLI |
|---|---|---|
| Install required | No | Yes (`npm install -g @goalpath/cli`) |
| Setup | Paste URL, log in via browser | Install, authenticate, link, configure |
| Project resolution | Manual (`set_active_project`) or automatic fallback | Automatic from `.goalpath` file in repo |
| Works on mobile / Claude.ai | Yes | No |
| Works with non-Claude AI tools | Yes (any MCP client with remote support) | Yes (any MCP client with stdio support) |
| Terminal commands | No | Yes (`goalpath items`, `goalpath status`) |
| Team project sharing | Via `set_active_project` per user | Via `.goalpath` file committed to repo |
## What your assistant can do
Both connection methods expose the same 38 tools across work management, planning, and project insights.
### The everyday workflow
| What you ask | What happens |
|---|---|
| "What's assigned to me?" | Calls `list_my_items` to show your items with status and priority |
| "Show me the details for this item" | Calls `get_item` to return the full description, subtasks, and comments |
| "Start working on the login bug" | Calls `set_item_status` to mark it as Started |
| "Check off the first subtask" | Calls `check_task`. Stakeholders see the checkbox update in real time |
| "Post a comment with the PR link" | Calls `add_comment` to add a note visible to the whole team |
| "Mark it as finished" | Calls `set_item_status` to move it to Finished |
| "Move this to the icebox" | Calls `move_to_icebox` to deprioritize the item |
### Milestones and planning
Your assistant can list milestones, read PRDs from milestone descriptions, create new items, move items between milestones, and check forecasts. Useful for planning sessions where you want to break a milestone into items without leaving your editor.
### Highlights and blockers
When your assistant hits a blocker or has a question about requirements, it can flag items directly:
- `set_item_highlight("Blocked", "Waiting for API credentials")`: flags the item and explains why
- `set_item_highlight("Question", "Should this support mobile?")`: surfaces the question to the team
These show up immediately in GoalPath for stakeholders and teammates to see.
### Project insights (Teams & Insights addon)
With the Teams & Insights addon, your assistant can answer questions about your project's health using the same data GoalPath's Insights dashboard shows:
| What you ask | What happens |
|---|---|
| "Are we on track?" | Calls `list_insights` to get GoalPath's precomputed analysis across 17 health dimensions |
| "What's our velocity trend?" | Calls `get_velocity_history` for week-by-week throughput data |
| "How much unplanned work are we taking on?" | Calls `get_unplanned_work_trend` for the planned vs unplanned ratio |
| "Where is work getting stuck?" | Calls `get_flow_metrics` for flow time, efficiency, and distribution |
| "How many items are blocked?" | Calls `get_highlight_count` for blocked, question, and discussion counts |
| "Is our inbox clean?" | Calls `get_triage_health` for inbox triage status |
GoalPath precomputes answers to 17 standard insight questions weekly, including signals, suggestions, and confidence levels. When your assistant uses `list_insights`, it gets GoalPath's own analysis rather than trying to interpret raw metrics, so answers are aligned with what the Insights dashboard shows.
Insight tools require the Teams & Insights addon ($49/mo). Without it, these tools return a message directing you to upgrade at Settings > Billing.
## How autonomous agents use it
GoalPath offers a full set of [AI skills](/docs/integrations/ai-skills) that turn your assistant into an autonomous collaborator, from discovering ideas to shipping PRs:
1. **Picks up an item**: reads the description and subtasks
2. **Sets status to Started**: the team sees work has begun
3. **Does the coding work**: implements the feature or fix
4. **Checks off subtasks**: progress is visible in real time, not batched at the end
5. **Posts a comment**: links the PR or summarizes what changed
6. **Marks it Finished**: signals that the work is ready for review
Stakeholders see progress as it happens. No one needs to write a status update or schedule a sync meeting.
## Configuration reference
### Where config lives (CLI only)
| File | Purpose | Scope |
|---|---|---|
| `~/.goalpath/config.json` | API key, default project | Per user |
| `.goalpath` | Linked project ID | Per repo (commit this) |
### Project resolution (CLI)
When the CLI needs to know which project to use, it checks in this order:
1. `GOALPATH_PROJECT_ID` environment variable (highest priority)
2. `.goalpath` file in the current directory or any parent
3. `defaultProjectId` from `~/.goalpath/config.json`
### Environment variables (CLI)
| Variable | Purpose |
|---|---|
| `GOALPATH_API_KEY` | API key (overrides config file) |
| `GOALPATH_URL` | Base URL (default: goalpath.app) |
| `GOALPATH_PROJECT_ID` | Project ID (overrides .goalpath file) |
---
#### AI Skills
# AI Skills
Go from a rough idea to a merged PR without leaving your terminal.
GoalPath's AI skills teach your coding assistant a structured development workflow: discover what to build, plan the work, implement it, and track progress, all while keeping GoalPath updated for your stakeholders.
AI skills require the [GoalPath CLI & MCP Server](/docs/integrations/cli-and-mcp-server). If you haven't set that up yet, start there.
## The Pipeline
Skills form a pipeline. Each step produces the input for the next:
```
discover → plan → implement (or work) → status
```
| Step | Skill | What happens |
|------|-------|-------------|
| **Discover** | `/goalpath-skills:goalpath-discover` | Rough idea becomes a milestone with a PRD |
| **Plan** | `/goalpath-skills:goalpath-plan` | PRD becomes prioritized items with estimates |
| **Implement** | `/goalpath-skills:goalpath-implement` | All items implemented on one branch, one PR |
| **Work** | `/goalpath-skills:goalpath-work` | Single item picked up and completed |
| **Status** | `/goalpath-skills:goalpath-status` | Quick view of assigned items and blockers |
You can enter the pipeline at any step. Have a PRD already? Skip straight to Plan. Have planned items? Jump to Implement or Work.
## Installation
### 1. Install the skills plugin
In Claude Code, run:
```
/plugin marketplace add morkeleb/goalpath-skills
/plugin install goalpath-skills
```
### 2. Verify
```
/goalpath-skills:goalpath-status
```
If you see your assigned items, you're set.
## Discover: Idea → PRD
Start with anything: a phrase, a URL to a barebones milestone, or a half-formed thought:
```
/goalpath-skills:goalpath-discover "we need milestone progress reports for stakeholders"
```
Your assistant acts as a product sparring partner. It won't just agree with you. It challenges scope, surfaces assumptions, and forces trade-offs:
- **Probes the problem** before jumping to solutions
- **Researches competitors** and best practices on the web
- **Checks your codebase** for what already exists and what's feasible
- **Drafts a PRD** and iterates with you until it's sharp
The result is a GoalPath milestone with a focused, opinionated PRD, not a vague feature list.
**What makes a good PRD?** One that someone could disagree with. If nobody can argue against your spec, it's too vague to build from.
### What the PRD includes
- **Purpose and primary outcome**: the single thing that's true when this ships
- **Success metrics**: how you'd know it's working
- **Design principles**: opinionated rules that guide decisions
- **Core sections**: broken into logical phases or components
- **Non-goals**: what you're explicitly not building
- **Open questions**: things deliberately left undecided, with context
## Plan: PRD → Items
Pass a milestone URL and your assistant breaks the PRD into work items:
```
/goalpath-skills:goalpath-plan https://goalpath.app/roadmaps/.../milestones/abc-123
```
The planning skill:
- **Explores your codebase** to understand what exists and what needs building
- **Proposes items** with types (Feature, Task, Bug), fibonacci estimates, subtasks, and dependencies
- **Resolves ambiguity during planning**: every item created is ready to start immediately
- **Creates items in GoalPath** after you approve the breakdown
Items are ordered by implementation priority: backend before frontend, dependencies before dependents, risk before routine.
**Estimates are calibrated for AI-assisted development.** A 3-point Feature means ~1-2 hours with an AI coding assistant, not the traditional full-day estimate. Most items should land at 1-3 points.
### Estimation rules
| Points | Scope | Time (with AI) |
|--------|-------|-----------------|
| **1** | Config change, copy tweak, one-line fix | ~30 min |
| **2** | Single change in one area | ~1 hour |
| **3** | Touches a few files, needs tests | ~1-2 hours |
| **5** | Spans multiple concerns, design decisions needed | ~half day |
| **8** | Complex and risky; consider splitting | ~full day |
Only Features get estimates. Tasks, Bugs, and Deadlines don't.
## Implement: Milestone → PR
Hand off an entire milestone for implementation:
```
/goalpath-skills:goalpath-implement https://goalpath.app/roadmaps/.../milestones/abc-123
```
Your assistant creates a feature branch and works through every item:
1. **Plans the order**: backend first, dependencies first, risky work first
2. **Delegates to specialist agents**: data model, backend logic, frontend, tests
3. **Checks off subtasks as work completes**: stakeholders see real-time progress in GoalPath
4. **Flags decisions that need your input**: keeps working with reasonable defaults and doesn't block
5. **Verifies build and tests pass**
6. **Opens a single PR** with all milestone work
The result: one branch, one PR, one migration (if applicable). GoalPath items are updated throughout, not batched at the end.
### How your assistant communicates during implementation
| Signal | What it means |
|--------|--------------|
| **Subtask checked off** | That piece of work is done. Stakeholders see progress in real time. |
| **Comment on item** | Summary of what was implemented, files changed, verification status. |
| **Question highlight** | Requirements are unclear. Includes a recommended default and what it'll do meanwhile. |
| **Blocked highlight** | External dependency preventing progress. Includes a workaround recommendation. |
Your assistant won't wait for you to respond to a highlight. It continues with its best judgment and documents the assumption. You can course-correct asynchronously.
## Work: Single Item → Code
Pick up one item instead of a full milestone:
```
/goalpath-skills:goalpath-work https://goalpath.app/roadmaps/.../items/def-456
```
Handles the full lifecycle:
1. Sets status to **Started**: the team sees work has begun
2. Explores relevant code for context
3. Implements with appropriate specialist agents
4. Checks off subtasks incrementally
5. Verifies build and tests pass
6. Sets status to **Finished** and posts a summary comment
If the item was previously **Rejected**, your assistant reads the rejection comments to understand what needs fixing, then re-implements.
**Rejected items aren't failures.** They're feedback. When an item is rejected, your assistant treats it as a bug fix: reads the comments, sets it back to Started, and addresses the issues.
## Status: Quick Check
```
/goalpath-skills:goalpath-status
```
Shows your assigned items grouped by urgency:
1. **Blocked / Needs Attention**: items with Question, Blocked, or Discussion highlights (shown first)
2. **In Progress**: Started items with subtask completion counts
3. **Ready to Start**: NotStarted items in priority order
4. **Recently Finished**: completed but not yet delivered
Ends with a summary line and a suggested next action:
> 2 in progress | 4 ready | 1 blocked | 14 total points in flight
>
> **Suggested**: The "API auth" item has a Question highlight. Resolve it before starting new work.
## Tips for Getting the Most Out of Skills
### Use the pipeline
The skills are designed to flow into each other. After Discover finishes, it suggests Plan. After Plan finishes, it suggests Implement. Follow the pipeline for the smoothest experience.
### Keep items small
The Plan skill targets 1-3 point items. If you find yourself with many 5s and 8s, ask the planner to split them further. Smaller items mean faster feedback loops and more accurate progress tracking.
### Let highlights work for you
When your assistant flags a Question or Blocked highlight, it shows up immediately in GoalPath for your team to see. You don't need to be in the terminal to respond. Answer in GoalPath and the assistant picks it up next time it checks.
### Check off subtasks as you go
Skills check off subtasks incrementally, not in a batch at the end. This means stakeholders watching in GoalPath see real-time progress. If you're working manually (without skills), do the same. It makes a real difference for stakeholder trust.
---
See also: [The Process with an AI Coding Assistant](/docs/process/with-ai-coding-assistant) for how the skills map onto GoalPath's four-phase process and a worked overnight-milestone example.
---
### Process Framework
#### The GoalPath Development Process
# The GoalPath Development Process
Most software teams operate in one of two failure modes: too much process (Jira boards with 200 fields nobody fills in) or too little (a shared Slack channel and a prayer). GoalPath is designed for the middle ground.
The GoalPath process is a structured development workflow built around Scrum principles, with a weekly cadence instead of configurable sprints, and automated facilitation instead of a dedicated scrum master. If your team already knows what velocity, story points, and retrospectives are, you already speak the language. The difference is that GoalPath runs the process. The tool shows you what to do next.
## The Four Phases
Work in GoalPath flows through four phases: Discovery, Planning, Execution, and Delivery. Each phase has clear inputs, outputs, and ceremonies. Each phase hands off cleanly to the next.
```mermaid
graph TD
A[Idea] --> B[Reverse Planning]
B --> C[Milestone with Scope]
C --> D[Break Down Items]
D --> E[Estimate and Prioritize]
E --> F[Ordered Backlog]
F --> G[Weekly Cadence]
G --> H[Standup / Build / Ship]
H --> I[Started > Finished > Delivered]
I --> G
G -.-> J[Velocity and Forecasts]
J -.-> K[Weekly Progress Reports]
K -.-> L[Alignment Meeting]
L -.-> G
```
The solid lines show work moving forward through four phases: **Discovery** (idea to scope), **Planning** (scope to backlog), and **Execution** (the weekly build cycle). The dotted lines show the **Delivery** feedback loop: velocity data feeds forecasts, forecasts feed reports, reports feed alignment meetings, and alignment meetings feed back into execution priorities.
### Discovery: From Idea to Defined Scope
Discovery turns a rough idea into a milestone with clear goals, defined scope, and mapped dependencies. The key technique here is reverse planning: start from the desired outcome and work backward to what needs to be true for that outcome to happen.
During Discovery, the team:
- Defines what success looks like for the milestone
- Identifies dependencies on other milestones or external systems
- Maps out risks and open questions
- Produces a milestone description that can drive planning
Discovery does not produce a full item list. That happens in Planning. Discovery produces scope clarity: enough shared understanding to plan confidently.
### Planning: Breaking Down the Work
Planning is a facilitated meeting where the team converts a milestone description into a prioritized, estimated item list. The team votes on priorities, breaks vague requirements into concrete work items, and assigns story point estimates.
The output of Planning: an ordered backlog of items, each with an estimate, that the team believes represents the full scope of the milestone.
Unplanned work is a fact of life. Planning doesn't eliminate surprises. It creates a shared baseline so that when surprises arrive, the team can assess impact against something concrete.
### Execution: Weekly Cadence
During Execution, the team works through the backlog on a weekly cadence. The kanban board shows the current state of all items. Standups keep the team aligned daily. WIP monitoring surfaces when too many things are in progress at once.
Items move through a defined status workflow:
| Status | Meaning |
| --- | --- |
| **NotStarted** | In the backlog, not yet being worked |
| **Started** | Actively in progress |
| **Finished** | Work complete, ready for review |
| **Delivered** | Shipped to production or handed to stakeholders |
| **Accepted** | Stakeholder confirmed it meets requirements |
| **Rejected** | Reviewed and does not meet requirements. Needs rework. |
This workflow is not ceremony for ceremony's sake. Each transition is a real handoff with a clear meaning. "Finished" and "Delivered" are different: something can be done technically but not yet in production. "Delivered" and "Accepted" are different: something can be in production but not yet verified by the person who asked for it.
### Delivery: Forecasting and Alignment
Delivery is not a phase with a hard start date. It runs alongside Execution. As items complete and velocity becomes measurable, GoalPath generates forecasts, health reports, and progress updates.
During Delivery, the team:
- Reviews forecast accuracy in alignment meetings
- Adjusts scope or priorities when the forecast diverges from targets
- Communicates progress to stakeholders via automated weekly reports
- Conducts retrospectives to improve the process itself
The goal of Delivery is shared reality: stakeholders and the team looking at the same numbers, with the same understanding of where things stand.
---
## What GoalPath Automates
Several parts of the process that traditionally require manual effort are automated in GoalPath. For a full explanation of the underlying calculations, see the [Automation and Principles](/docs/process/automation-and-principles) guide.
**Velocity tracking.** GoalPath measures story points completed per work-week over a rolling 6-week window. You never need to calculate or update this manually.
**Monte Carlo delivery forecasts.** Based on velocity, multitasking load, and estimate confidence, GoalPath generates three-point delivery forecasts: optimistic, expected, and pessimistic. Forecasts update as work completes.
**Weekly progress reports.** Every Sunday night, GoalPath generates a plain-English progress update covering what shipped, what's blocked, and how the forecast changed. Ready for stakeholders on Monday morning.
**Milestone health monitoring.** GoalPath surfaces warning signals automatically: milestones with high multitasking penalties, items stuck in Started, unestimated backlogs, and forecast slippage.
**WIP and flow visibility.** The kanban board and delivery probability lines show the current state of flow without requiring manual calculation.
---
## Roles
GoalPath has four process roles. Access permissions map to these roles, but more importantly, each role has a defined set of responsibilities in the process.
| Role | Responsibilities |
| --- | --- |
| **Owner** | Project administration, team setup, billing, and ultimate accountability for delivery |
| **Project Leader** | Milestone planning, priority decisions, cross-team coordination, and voting |
| **Collaborator** | Day-to-day execution: creating items, tracking progress, and driving milestones forward |
| **Stakeholder** | Providing business context, voting on priorities, and reviewing delivered work |
Viewer is an access role, not a process role. Viewers can see roadmap and milestone data but do not participate in the process.
Full role guides:
- [Owner](/docs/process/roles/owner)
- [Project Leader](/docs/process/roles/project-leader)
- [Collaborator](/docs/process/roles/collaborator)
- [Stakeholder](/docs/process/roles/stakeholder)
---
## Ceremonies
GoalPath has five ceremonies. Two are facilitated directly in the tool with step-by-step guidance. Three are process guides the team runs with GoalPath data as input.
### Alignment Meeting
A regular meeting between the team and stakeholders to review progress, assess forecast changes, and make course-correction decisions. GoalPath facilitates this as a 6-stage structured meeting: Progress and Flow Snapshot, Flow Health and Escalation, Business Value Voting, Visual Roadmap, Roadmap Update, and Decisions and Summary.
[Alignment Meeting guide](/docs/process/ceremonies/alignment-meeting)
### Milestone Planning
The meeting where a new milestone gets broken down into a prioritized, estimated item list. The team reviews the milestone description, proposes items, estimates them with story points, and sets priority order.
[Milestone Planning guide](/docs/process/ceremonies/milestone-planning)
### Roadmap Planning
A higher-level planning session where the team reviews the full milestone roadmap, adjusts milestone priorities, and ensures the next 2-3 milestones have clear enough scope to plan.
[Roadmap Planning guide](/docs/process/ceremonies/roadmap-planning)
### Standup
The daily team sync. GoalPath facilitates standup as a 4-stage structured meeting: Inbox, Highlighted Items, Team Members, and Let's Get Going. Each team member walks through their items. The interface surfaces what matters.
[Standup guide](/docs/process/ceremonies/standup)
### Retrospective
A regular meeting for the team to assess the process itself: what worked, what didn't, and what to change. Retrospectives use GoalPath velocity and health data as a factual starting point before moving to discussion.
[Retrospective guide](/docs/process/ceremonies/retrospective)
---
## How This Relates to Scrum
GoalPath is built on Scrum principles. If you've used Scrum, almost nothing here is unfamiliar: velocity, story points, a defined backlog, iterative delivery, retrospectives.
The main differences:
**Weekly cadence, not configurable sprints.** GoalPath uses a fixed weekly rhythm. There's no sprint setup, no sprint close ceremony, no sprint board to manage separately. The cadence is always one week.
**Automated facilitation, not a dedicated scrum master.** A scrum master's job is to run ceremonies, surface blockers, protect the team from distraction, and keep the process honest. GoalPath does this through the interface. Standups are guided. Alignment meetings are structured. The tool asks the right questions at the right time.
**Forecasts, not velocity targets.** Scrum teams often use velocity to set sprint goals: "we deliver 40 points per sprint." GoalPath uses velocity as input to forecasts: "at current velocity, this milestone completes in 7 weeks." The goal is honesty about timelines, not pressure to hit a number.
For a detailed comparison with Scrum and other frameworks, see the [Process Comparison](/docs/process/comparison) guide.
---
## Getting Started
**Find your role.** Start with the guide for your role to understand your responsibilities in the process.
- [I'm an Owner](/docs/process/roles/owner): Project setup, team structure, and accountability
- [I'm a Project Leader](/docs/process/roles/project-leader): Milestone planning, prioritization, and cross-team coordination
- [I'm a Collaborator](/docs/process/roles/collaborator): Day-to-day work, standups, and driving items to done
- [I'm a Stakeholder](/docs/process/roles/stakeholder): Voting, progress review, and accepting delivered work
**Prepare for your next meeting.** If a ceremony is coming up, the guides explain exactly what to prepare and what happens during each stage.
- [Standup](/docs/process/ceremonies/standup): Daily, runs in GoalPath
- [Milestone Planning](/docs/process/ceremonies/milestone-planning): When starting a new milestone
- [Alignment Meeting](/docs/process/ceremonies/alignment-meeting): Regular stakeholder sync, runs in GoalPath
- [Retrospective](/docs/process/ceremonies/retrospective): End of milestone or monthly
- [Roadmap Planning](/docs/process/ceremonies/roadmap-planning): Quarterly or when roadmap needs reordering
**Already using GoalPath?** The process guides assume you have a project set up. If you're just getting started, the [Quick Start guide](/docs/getting-started/quick-start) walks through creating your first project and milestone.
---
#### Owner Role Guide
# Owner Role Guide
The Owner is accountable for the project. Not just for setup and settings, but for the outcome: work shipped to the right standard, stakeholders aligned, and the team not blocked by process failures. Every project needs exactly one person who holds this accountability. That person is the Owner.
This guide covers what Owners actually contribute to the process, not just what buttons they can click. For the full permissions matrix, see [User Roles & Permissions](/docs/features/user-roles).
---
## Responsibilities
**Project administration.** The Owner configures the project, manages team membership, and controls access. This includes inviting members, assigning roles, and adjusting settings as the team evolves. These are one-time-or-rare tasks, but they matter for keeping the process clean.
**Strategic direction.** The Owner makes the call when priorities conflict. When the team is debating whether to push a milestone deadline or cut scope, the Owner decides. Not by fiat, but by synthesizing the inputs: forecast data, stakeholder feedback, and team capacity.
**Milestone acceptance.** When a milestone is Delivered, someone has to verify it meets requirements and mark it Accepted. That is the Owner's job. The transition from Delivered to Accepted is a quality gate. The Owner confirms the work is what was asked for before the team moves on.
**Business context in ceremonies.** Alignment meetings, roadmap planning, and milestone planning all produce better outcomes when the Owner contributes the business context that only they hold. What are the external commitments? What does the customer actually need? What is the consequence of a late milestone? This is the Owner's contribution, not running the meeting.
**Team health.** Owners monitor highlights: blockers, questions, and discussions that have gone unresolved. If a Collaborator has flagged something as Blocked for three days, the Owner needs to know and act.
---
## Meeting Participation
GoalPath facilitates ceremonies. Any team member can click through the stages. The Owner's job in each ceremony is to contribute, not to chair.
| Ceremony | Owner's Contribution |
| --- | --- |
| [Alignment Meeting](/docs/process/ceremonies/alignment-meeting) | Provides business context for scope decisions. Makes final call on priority conflicts. Accepts or rejects proposed scope changes. |
| [Milestone Planning](/docs/process/ceremonies/milestone-planning) | Provides business context for estimates and priorities. Clarifies acceptance criteria so the team knows what Done means. |
| [Roadmap Planning](/docs/process/ceremonies/roadmap-planning) | Contributes strategic framing. Owns the final milestone order when votes are tied or context requires a judgment call. |
| [Standup](/docs/process/ceremonies/standup) | Monitors blockers and team state. Intervenes if a blocker needs Owner-level resolution. The standup runs whether or not the Owner attends. |
| [Retrospective](/docs/process/ceremonies/retrospective) | Responds to process improvement proposals that require scope or resourcing decisions. |
---
## Daily Workflow
The Owner's day starts with a strategic scan, not a task list. The dashboard surfaces what needs attention. Most days, the Owner's job is to unblock, decide, or accept, not to execute.
```mermaid
graph TD
A[Check Dashboard] --> B{Highlights or blockers?}
B -->|Yes| C[Resolve or respond]
B -->|No| D[Review delivered milestones]
C --> D
D --> E{Milestone ready to accept?}
E -->|Yes| F[Verify and mark Accepted]
E -->|No| G[Review roadmap and priorities]
F --> G
G --> H[End of review]
```
**Check the dashboard.** GoalPath surfaces active highlights, forecast changes, and milestones approaching deadlines. Review this before anything else.
**Handle blockers.** If team members have flagged items as Blocked or raised Questions, address them. A blocked item that sits for a day costs delivery time. The Owner's job is to clear the path.
**Accept delivered milestones.** Work marked Delivered by the team is waiting for Owner verification. Open the milestone, confirm it meets the stated requirements, and mark it Accepted. If it does not meet requirements, add a comment explaining what needs to change and move relevant items back to Started.
**Stay current on the roadmap.** The Owner does not need to run planning sessions to stay oriented. Reviewing the roadmap and forecast regularly means the Owner can contribute meaningfully when those sessions happen, without scrambling to catch up.
---
## Permissions
Owners have full access to all project features:
- All settings and project configuration
- Member management: invite, remove, change roles
- Billing and subscription management
- Team creation and management
- All execution features: board, standup, items, milestones
- Voting on milestone priorities
- Time reports and velocity data
For the complete list, see the [Permission Matrix](/docs/features/user-roles#permission-matrix).
---
## When to Use This Role
The Owner role fits people who:
- Are accountable for what the team delivers, not just for their own work items
- Make scope and priority decisions when requirements conflict
- Have the organizational context to verify that delivered work meets business needs
- Carry the business context that shapes what the team builds and in what order
Common fits: founders, engineering managers, product leads, and anyone who would be called when a milestone misses its target date.
**One Owner per project.** GoalPath allows multiple Owners, but diffuse ownership creates ambiguity. If two people can each accept milestones or change priorities, it becomes unclear whose call it is. Keep Owner access to the person who is actually accountable.
---
## How GoalPath Supports This Role
The Owner role is designed around oversight, not execution overhead. GoalPath surfaces what needs the Owner's attention instead of requiring the Owner to go looking for it.
Delivered milestones appear on the dashboard, waiting for acceptance. Highlights flag blockers and questions. Forecast charts show when a milestone is trending toward a missed date before the date arrives. Ceremonies are structured so the Owner can show up, contribute business context, make decisions, and leave with clarity, without needing to manually compile status from the team beforehand.
The goal is to give the Owner enough signal to make good decisions, without burying them in execution detail.
---
#### Project Leader Role Guide
# Project Leader Role Guide
The Project Leader keeps execution on track. They sit between the Owner's strategic decisions and the Collaborators doing the work: translating priorities into a clear backlog, removing blockers before they compound, and making sure the team knows what to work on next.
This is not a scrum master role. GoalPath handles most of what a scrum master does through the interface itself: ceremony structure, WIP monitoring, velocity tracking. The Project Leader's job is the coordination work the tool cannot do, which is mostly about people and judgment, not process mechanics.
This guide covers what Project Leaders contribute to the process. For the full permissions matrix, see [User Roles & Permissions](/docs/features/user-roles).
---
## Responsibilities
**Team coordination.** The Project Leader monitors what the team is working on and intervenes when work is piling up in the wrong places. Too many items Started at once means flow is breaking down. Items sitting in Finished without being moved to Delivered means handoffs are stalling. The Project Leader spots these patterns and fixes them.
**Technical input in planning.** When a new milestone enters planning, the Project Leader contributes the technical perspective: what is actually involved, where the unknowns are, whether the proposed scope is realistic. This is a contribution to the session, not a facilitation role. Anyone on the team can walk through the planning stages in GoalPath.
**Roadmap reordering.** Project Leaders can reorder items and milestones. When the team has finished a batch of high-priority items and needs to know what comes next, the Project Leader ensures the roadmap reflects the current priority order.
**Priority voting.** Project Leaders vote in milestone prioritization voting, alongside Owners and Stakeholders. This reflects their role: they have enough business context to weigh in on priorities, not just estimate technical effort.
**Unblocking individuals.** When a Collaborator flags a blocker, the Project Leader acts on it: makes the call, routes it to the Owner, or finds the dependency that needs to move. A blocked item acknowledged but not resolved is still a blocked item.
---
## Meeting Participation
GoalPath facilitates ceremonies. Any team member can click through the stages in a standup, planning session, or retrospective. The Project Leader's job in each ceremony is to contribute technical coordination, not to chair.
| Ceremony | Project Leader's Contribution |
| --- | --- |
| [Alignment Meeting](/docs/process/ceremonies/alignment-meeting) | Contributes technical input on scope decisions. Votes on milestone priorities. Flags when proposed changes have technical consequences the business side may not see. |
| [Milestone Planning](/docs/process/ceremonies/milestone-planning) | Provides technical breakdown and estimation input. Challenges scope assumptions. Ensures the resulting backlog reflects what implementation actually requires. |
| [Roadmap Planning](/docs/process/ceremonies/roadmap-planning) | Contributes to milestone ordering and readiness assessment. Identifies technical sequencing constraints. |
| [Standup](/docs/process/ceremonies/standup) | Attends and spots when flow is breaking down: blockers unresolved, WIP accumulating, items stalling between statuses. Anyone on the team can run the standup. |
| [Retrospective](/docs/process/ceremonies/retrospective) | Contributes process improvement proposals based on what they observe during coordination. Often has the clearest view of where execution is grinding. |
---
## Daily Workflow
The Project Leader's day starts with the team's current state. What is in progress, what is blocked, and whether the work is flowing. Then they act on what they find before pulling their own work.
```mermaid
graph TD
A[Check Team WIP and Highlights] --> B{Blocked items?}
B -->|Yes| C[Unblock or route to Owner]
B -->|No| D[Review Milestone Health]
C --> D
D --> E{Any flow problems?}
E -->|Yes| F[Address WIP or stalled handoffs]
E -->|No| G[Pull Highest Priority Item]
F --> G
G --> H[Execute and Update Status]
```
**Check team WIP and highlights.** Open the board or dashboard and review what the team has Started. If multiple people are working on many items at once, that is a signal to investigate. Check for Blocked and Question highlights. These are the items that will derail the week if left unattended.
**Unblock team members.** Blocked items need action, not acknowledgment. If a Collaborator is blocked on a dependency, the Project Leader makes the call or goes to the Owner to make it. If a Collaborator has raised a Question, answer it or route it to whoever can.
**Review milestone health.** GoalPath's forecast and health indicators show whether the current milestone is on track. A forecast that has slipped several weeks in a row is a pattern worth addressing before the alignment meeting, not during it.
**Pull work.** After handling coordination, the Project Leader works like a Collaborator: pick the highest-priority unstarted item and work on it.
---
## Permissions
Project Leaders have all Collaborator permissions plus:
- Vote on milestone prioritization
- Reorder items and milestones on the roadmap
They cannot:
- Modify project settings
- Manage billing
- Invite or remove members
For the complete list, see the [Permission Matrix](/docs/features/user-roles#permission-matrix).
---
## When to Use This Role
The Project Leader role fits people who:
- Are responsible for how the team executes, not just for their own work items
- Have enough context to make priority calls and estimation judgments
- Are willing to coordinate teammates and unblock work as part of their regular responsibilities
- Need both execution access and some planning authority
Common fits: tech leads, senior developers coordinating a team, team leads who also write code.
**One or two Project Leaders per project.** More than two creates the same diffuse ownership problem as multiple Owners. If three people can reorder the backlog, nobody is accountable for what order it is in.
---
## The Coordination Tax
Every Project Leader should be honest about the coordination tax. The time spent checking the board, unblocking teammates, and contributing to planning sessions is real time that does not go to implementation. That is the trade.
A Collaborator who gets promoted to Project Leader without capacity adjustment will underdeliver on both coordination and execution. Adjust the work expectation when someone takes on this role. A Project Leader who is also expected to carry the same implementation load as a Collaborator will fail at both.
---
## How GoalPath Supports This Role
GoalPath reduces the administrative load that traditionally falls on a team lead or scrum master. Ceremonies are structured so any team member can run them, which means the Project Leader does not need to carry every standup or planning session personally. Milestone health signals surface automatically, so the Project Leader does not need to maintain a separate status spreadsheet. Voting is built into the alignment meeting, so priority conflicts get resolved in a structured way rather than in hallway conversations.
The Project Leader's real contribution is judgment and human coordination: reading the room, making calls when the data is ambiguous, and keeping individuals unblocked. GoalPath handles the rest.
---
#### Collaborator Role Guide
# Collaborator Role Guide
Collaborators do the work. They create items, move them through the workflow, write estimates, and drive milestones to completion. Most of the people on a development team should be Collaborators.
The role is designed around a simple question the interface answers every day: what should I work on next? You do not need to figure this out yourself. The standup view surfaces it. The backlog is ordered by priority. Highlights tell you when something needs attention before you pull new work.
This guide covers how Collaborators operate within the process. For the full permissions matrix, see [User Roles & Permissions](/docs/features/user-roles).
---
## Responsibilities
**Creating and managing items.** Collaborators create work items when they discover scope that is not yet captured: bugs found during development, technical tasks that emerge from implementation, subtasks needed to complete a larger item. Items should be concrete enough to estimate and small enough to finish within a day or two.
**Moving items through the workflow.** The status workflow is a communication tool as much as a tracking tool. When you start working on something, mark it Started. When your work is done, mark it Finished. When it has been shipped or handed off, mark it Delivered. Each transition tells the team something real.
**Adding estimates.** Collaborators add story point estimates to items. Estimation is not a precision exercise. It is a shared calibration: the team agreeing on relative size so velocity calculations mean something. An item with no estimate cannot contribute to the forecast.
**Surfacing blockers.** When something is preventing you from making progress, flag it immediately. Use the Blocked highlight and add a note explaining what is in the way. The team and Owner see this automatically. A blocker left unflagged for two days is two days of invisible delay.
**Participating in ceremonies.** Collaborators attend milestone planning, standups, and retrospectives. Any Collaborator can run the standup, since GoalPath structures the stages. In milestone planning, they provide the estimates that make the backlog credible. In retrospectives, they identify what is actually slowing the team down.
---
## The Item Status Workflow
Items move through a defined sequence. Each status has a concrete meaning.
| Status | Meaning |
| --- | --- |
| **NotStarted** | In the backlog. Not yet being worked. |
| **Started** | Actively in progress. You are working on this now. |
| **Finished** | Your work is complete. Ready for review or handoff. |
| **Delivered** | Shipped to production or handed to the stakeholder who asked for it. |
| **Accepted** | Verified by the Owner or Project Leader. Meets requirements. |
| **Rejected** | Reviewed and does not meet requirements. Needs rework. |
The distinction between Finished and Delivered matters. Finished means the code is written and tested. Delivered means it is actually in the hands of whoever needs it. Skipping Delivered because "it will go out in the next deploy" is how teams lose track of what has and has not shipped.
Accepted is not something Collaborators set. The Owner or Project Leader marks Accepted after verifying the work.
---
## Meeting Participation
| Ceremony | Collaborator's Contribution |
| --- | --- |
| [Standup](/docs/process/ceremonies/standup) | Core participant. Can run the standup by clicking through the stages in GoalPath. Reports blockers, in-progress work, what finishes today, what starts today. |
| [Milestone Planning](/docs/process/ceremonies/milestone-planning) | Core participant. Proposes items, provides estimates, challenges scope assumptions. |
| [Retrospective](/docs/process/ceremonies/retrospective) | Core participant. Identifies process friction and improvement opportunities. |
| [Alignment Meeting](/docs/process/ceremonies/alignment-meeting) | Attends, does not vote. Can raise blockers for stakeholder visibility. |
| [Roadmap Planning](/docs/process/ceremonies/roadmap-planning) | Optional. Attends when there is technical input to provide on milestone scope or sequencing. |
---
## Daily Workflow
The standup view is the starting point for the day. It organizes your work by what matters now, not by creation date or alphabetical order.
```mermaid
graph TD
A[Open Standup View] --> B{Any highlights?}
B -->|Blocked or Question| C[Resolve or flag with a comment]
B -->|None| D[Check Started items]
C --> D
D --> E{Active item to continue?}
E -->|Yes| F[Continue working]
E -->|No| G[Pull next item from backlog]
F --> H[Update status when done]
G --> H
H --> B
```
**Open the standup view.** This surfaces your current items organized by status. If you have items in Started, those come first. Items with highlights come before everything else.
**Handle highlights.** Before pulling new work, clear your highlights. If you have items marked Blocked, do something about the blocker: add more detail, flag it with a comment so the team sees it, or note what decision is needed. If you have a Question highlight on an item, get the answer before proceeding.
**Continue active work.** If you have items in Started, continue them. Starting a new item before finishing the current one increases WIP and degrades forecast accuracy. Finish what you started.
**Pull the next item.** When your current item is finished and moved to the right status, pull the next highest-priority item from the backlog. The priority order is set by the Project Leader and Owner. You do not need to decide what is most important. Pick the item at the top.
**Update status when done.** Mark items Finished when your work is complete. If the item is going straight to production, mark it Delivered. Do not let items sit in Started after you have stopped working on them. Stale statuses mislead the team and corrupt velocity metrics.
---
## Using Highlights
Highlights are signals to the team. Use them when something needs attention beyond normal status updates.
| Highlight | When to use |
| --- | --- |
| **Blocked** | Something is preventing you from making progress. Dependency not ready, decision not made, environment broken. Flag it with a comment and the team sees it automatically. |
| **Question** | You need clarification before you can proceed. Unclear requirements, conflicting specs, ambiguous acceptance criteria. |
| **Discussion** | The item raises something the team needs to talk through. Scope change discovered during implementation, technical approach decision. |
Set the highlight and add a comment explaining the situation. Do not leave a highlight without context. "Blocked" with no explanation is not actionable.
---
## Estimation
Collaborators add story point estimates using a Fibonacci scale: 1, 2, 3, 5, 8.
Estimates are relative. A 3-point item is not three hours of work. It is an item the team considers roughly twice the size of a 1-point item. The absolute numbers do not matter as long as the team applies them consistently.
Rough calibration:
| Points | What it typically means |
| --- | --- |
| 1 | Trivial change. Single file, obvious implementation, no risk. |
| 2 | Small but real work. Clear scope, low risk. |
| 3 | Typical feature. Multiple components, some decisions to make. |
| 5 | Large feature. Several unknowns, meaningful implementation time. |
| 8 | Very large. Consider splitting before starting. |
If an item is an 8, try to split it. Items that are too large to complete in a few days are harder to track, harder to estimate accurately, and harder to unblock if something goes wrong.
Unestimated items do not count in velocity calculations. An unestimated backlog produces unreliable forecasts. Estimate items during planning, and add estimates to new items as you create them.
---
## When to Use This Role
The Collaborator role fits anyone actively doing the work: developers, designers, QA engineers, technical writers, anyone creating deliverables. If your primary contribution is building things rather than setting direction or observing progress, Collaborator is the right role.
Collaborators who consistently demonstrate good judgment about priorities and technical decisions are good candidates for the Project Leader role.
---
## How GoalPath Supports This Role
The Collaborator interface is designed around one problem: knowing what to work on next. The standup view organizes your items so the answer is always visible. Highlights surface what needs attention before you can pull new work. The backlog is ordered so you never need to decide priorities yourself.
GoalPath also provides the data that makes estimates meaningful. Velocity tracking shows how the team's actuals compare to estimates over time, which helps calibrate future estimates. The forecast shows the real impact of finishing items quickly or getting blocked, which makes day-to-day status updates feel connected to something that matters.
---
#### Stakeholder Role Guide
# Stakeholder Role Guide
Stakeholders influence what gets built and in what order. They do not manage the work. They provide the business context that makes prioritization decisions meaningful: which milestones matter most to customers, which deliverables are tied to revenue or commitments, which features will actually move the needle.
The Stakeholder role is designed to give this kind of input without requiring involvement in execution details. Stakeholders vote on priorities, review roadmap progress, and engage at alignment meetings. They do not see the kanban board, manage items, or attend daily standups.
This guide covers how Stakeholders participate in the process. For the full permissions matrix, see [User Roles & Permissions](/docs/features/user-roles).
---
## Responsibilities
**Voting on milestone priorities.** The primary Stakeholder contribution is voting. In alignment meetings and roadmap planning sessions, Stakeholders vote on which milestones should be prioritized. These votes give the team real signal: not what the loudest voice in the room wants, but what the people closest to business outcomes believe matters most.
**Reviewing roadmap progress.** Stakeholders see the roadmap and milestone status. They can track whether milestones are on track, see delivery forecasts, and understand how completed work compares to the plan. This visibility is the basis for informed prioritization: you cannot vote well on what comes next if you do not know where things stand.
**Providing feedback at alignment meetings.** Alignment meetings are where Stakeholders engage most directly with the team. The meeting covers forecast changes, milestone health, blockers with business impact, and scope decisions. Stakeholder feedback here directly shapes what the team works on.
**Setting business context for priorities.** Stakeholders often know things the team does not: upcoming customer commitments, market timing, regulatory deadlines, or competitive pressures. Surfacing this context during priority discussions helps the team make better decisions about what to push and what to defer.
---
## What Stakeholders See
GoalPath gives Stakeholders a strategic view of the project, not an execution view.
**Visible to Stakeholders:**
- Dashboard and project overview
- Roadmap (read-only): milestone sequence, status, and forecast
- Milestone detail: scope, progress, and delivery probability
- Voting interface for milestone prioritization
- Team members
**Not visible to Stakeholders:**
- Kanban board (execution detail)
- Standup view (daily team mechanics)
- Time reports and velocity metrics (team performance data)
- Individual item-level detail beyond what appears on milestones
This boundary is intentional. Execution details create noise for Stakeholders and can draw attention away from strategic input. A Stakeholder who can see every item in every cycle tends to engage at the item level instead of the milestone level, which is where their judgment is most valuable.
---
## Meeting Participation
Stakeholders engage with the roadmap when decisions need their input. Progress reports arrive automatically, and alignment meetings happen on a cadence the team sets.
| Ceremony | Stakeholder's Contribution |
| --- | --- |
| [Alignment Meeting](/docs/process/ceremonies/alignment-meeting) | Core participant. Attends voting stage. Provides business context for scope decisions. |
| [Roadmap Planning](/docs/process/ceremonies/roadmap-planning) | Participates. Votes on milestone priority order. |
| [Milestone Planning](/docs/process/ceremonies/milestone-planning) | Optional. May attend to provide business context for scope decisions. No voting on item-level priorities. |
| Standup | Not invited. Execution detail, not relevant to Stakeholder contributions. |
| Retrospective | Not invited. Internal team process review. |
---
## Engagement Workflow
Stakeholders do not need to check GoalPath every day. The tool sends automated progress reports so the Stakeholder can stay current without monitoring execution. The job is to engage meaningfully at the right moments.
```mermaid
graph TD
A[Receive Progress Report] --> B[Review Roadmap for Changes]
B --> C{Alignment meeting coming up?}
C -->|Yes| D[Prepare priorities and business context]
C -->|No| E[Note questions for next meeting]
D --> F[Attend Alignment Meeting]
F --> G[Vote on milestone priorities]
G --> H[Provide feedback on scope or direction]
H --> E
E --> A
```
**Receive the progress report.** GoalPath sends automated summaries covering what shipped, what is in progress, how the forecast changed, and what decisions are needed. This is the primary touchpoint for Stakeholders between meetings.
**Review the roadmap.** Before an alignment meeting, open the roadmap and check the current milestone state. Which milestones have forecast changes? Which are further along or behind than expected? Reviewing this before the meeting means the Stakeholder can engage substantively instead of spending the first ten minutes getting oriented.
**Prepare priorities and business context.** The voting stage of an alignment meeting goes better when Stakeholders have thought through their priorities before arriving. What is the most important milestone from a business perspective right now? Has anything changed since the last meeting: new customer commitments, competitive pressure, or changed internal priorities?
**Attend the alignment meeting.** The alignment meeting has a structured voting stage where Stakeholders rank milestone priorities using the framework the team has adopted (RICE, MoSCoW, Impact/Effort, or Weighted Scoring). The team uses these votes to set or confirm the roadmap order.
**Provide feedback on scope and direction.** Beyond voting, Stakeholders contribute by flagging when a milestone scope does not match what the business actually needs, or when the proposed delivery timeline conflicts with an external commitment. This feedback is most useful when it comes with specific business context, not just a preference.
---
## Voting
Stakeholder votes carry real weight in priority decisions. GoalPath supports several voting frameworks:
**RICE** (Reach, Impact, Confidence, Effort): Score each milestone on four dimensions. Good when you need to balance scope and effort explicitly.
**MoSCoW** (Must, Should, Could, Won't): Categorize milestones by necessity. Good for roadmap conversations where some items are non-negotiable and others are aspirational.
**Impact/Effort**: Simple two-axis ranking. Good when the team needs a quick priority sort without detailed scoring.
**Weighted Scoring**: Teams define their own scoring criteria with custom weights, matching how their organization makes decisions.
Voting is not a popularity contest. The most important Stakeholder contribution is the reasoning behind the vote, not the vote itself. "I'm voting this milestone highest because we have a committed demo to a prospect in six weeks" is more useful to the team than a score without context.
---
## When to Use This Role
The Stakeholder role fits people who:
- Influence what gets built but do not execute the work
- Have business context the development team needs for good prioritization
- Need visibility into progress without needing execution detail
- Attend alignment meetings and provide directional feedback
Common fits: product managers with prioritization authority, executives monitoring delivery, customer representatives or client contacts voting on feature priorities, business analysts who define requirements but do not build them.
**The Stakeholder role is not for passive observers.** If someone only needs to see the roadmap without contributing to priority decisions, the Viewer role is more appropriate. The Stakeholder role is for people who actively shape what gets built.
---
## How GoalPath Supports This Role
GoalPath gives Stakeholders meaningful participation without the overhead of managing execution. Automated progress reports mean Stakeholders stay informed without needing to check in manually. The structured alignment meeting means priority discussions happen in a defined, time-bounded format rather than sprawling conversations with unclear outcomes.
The voting system translates business input into a format the team can act on. Stakeholders do not need to understand story points or velocity to contribute meaningfully to roadmap decisions. They need to understand business priorities, and that is exactly what the voting stage asks them to provide.
---
#### Viewer Role Guide
# Viewer Role Guide
Viewers observe. They see the roadmap, track milestone progress, and can leave a comment when they have something to add, but they do not vote on priorities, reorder the roadmap, or get anywhere near execution detail. The Viewer role exists for people who need visibility into a project without a stake in how it gets built.
Unlike the other four roles, Viewer is not a process role in the sense the rest of this guide series uses the term: it carries no defined responsibilities in planning, execution, or prioritization ceremonies. It is an access role, scoped down to the minimum: see what's happening, say something if needed, participate in nothing else.
This guide covers what Viewers can see and do. For the full permissions matrix, see [User Roles & Permissions](/docs/features/user-roles).
---
## What Viewers See
GoalPath gives Viewers the same read-only project visibility as Stakeholders, minus the voting interface.
**Visible to Viewers:**
- Dashboard and project overview
- Roadmap (read-only): milestone sequence and status
- Milestones (read-only): scope and progress
- Alignment meeting view (read-only, cannot vote or advance stages)
- Team members
- Search
**Not visible to Viewers:**
- Kanban board and work queue (execution detail)
- Standup view (daily team mechanics)
- Time reports and velocity metrics (team performance data)
- Voting interface (Viewers do not vote on milestone prioritization)
- The planning view used to reorder the roadmap or sort by business value
- Individual item and subtask detail beyond what appears on milestones
- Project settings, billing, and member management
**The one write action Viewers have:** Viewers can add comments. It's useful for a client or external observer who wants to leave a note or ask a question without needing execution access.
This boundary is intentional. A Viewer who can edit or vote isn't a Viewer; at that point the right move is to upgrade them to Stakeholder or Collaborator, not to bend the Viewer role to fit.
---
## Meeting Participation
Viewers are not core participants in any ceremony. GoalPath doesn't hide the alignment meeting from them, but they can't vote or control stage progression.
| Ceremony | Viewer's Participation |
| --- | --- |
| [Alignment Meeting](/docs/process/ceremonies/alignment-meeting) | Can view the meeting. Cannot vote or advance stages. |
| [Roadmap Planning](/docs/process/ceremonies/roadmap-planning) | Not a participant. No reordering or business-value-sort access. |
| [Milestone Planning](/docs/process/ceremonies/milestone-planning) | Not a participant. No estimation or item creation access. |
| Standup | Not invited. No board or execution visibility. |
| Retrospective | Not invited. Internal team process review. |
---
## When to Use This Role
The Viewer role fits people who:
- Need to see project status without any operational stake in it
- Should not influence prioritization (if they should, use Stakeholder instead)
- Are external to the core team: clients, auditors, temporary observers, or leadership outside the immediate project
- Need occasional visibility, not a standing seat in the process
Common fits: clients checking on delivery status, auditors or compliance reviewers, executives outside the project's direct chain who want visibility without a vote, contractors whose engagement has ended but who still need historical access.
**Start from Stakeholder, downgrade to Viewer.** Most people added to a project have some stake in its priorities. If someone's involvement in prioritization ends but they still need visibility, that's the point to move them from Stakeholder to Viewer. See the [Stakeholder Role Guide](/docs/process/roles/stakeholder) for what the extra access adds.
One practical note: Viewer is the only role that does not count toward billable project seats, which makes it the right default when granting access to someone outside the core team.
---
## How GoalPath Supports This Role
GoalPath keeps the Viewer's surface area deliberately small. There's no board to misread, no estimate to second-guess, no vote to cast without context. The roadmap and milestone views give Viewers exactly the signal they need: what's planned, what's shipped, and how things are trending, without the noise of daily execution detail.
If a Viewer starts needing to weigh in on priorities rather than just observe them, that's a sign the role should be upgraded to Stakeholder, not that the Viewer role needs new capabilities.
---
#### Milestone Planning: Facilitator Guide
# Milestone Planning: Facilitator Guide
A milestone planning meeting is where scope becomes a plan. You arrive with a milestone description. You leave with a list of concrete items, estimates, and an agreed execution order.
This guide gives facilitators everything they need to run an effective planning meeting: who to invite, what to prepare, and a full agenda with time estimates. The process works whether you're using GoalPath or not.
---
## When to Run This Meeting
A milestone planning meeting is appropriate when a milestone moves from Concept to Planned. The trigger is scope clarity, not calendar date.
Ask yourself: do you know enough about what needs to be built to break it into concrete items? If yes, plan it. If the answer is "it depends on decisions we haven't made yet," run a discovery session first.
Signs a milestone is ready to plan:
- The goal is clear: you can state what the milestone delivers in one sentence
- The major unknowns are resolved, or you know how to resolve them during planning
- The team that will build it is identified
Signs it is not ready:
- The scope is still being negotiated with stakeholders
- A significant dependency hasn't been confirmed
- The requirements document exists but nobody has read it
---
## Who Attends
**Owner or Project Leader** (facilitates): Controls the agenda, keeps discussion focused, makes calls on scope questions. See the [Owner](/docs/process/roles/owner) and [Project Leader](/docs/process/roles/project-leader) role guides for details on facilitation responsibilities.
**Collaborators** (required): The people who will build the work. Their input on how to break down scope and estimate effort is essential. If they're not in the room, the plan will be wrong.
**Stakeholders** (optional): Useful for answering scope questions in real time. Not needed for the estimation and ordering discussion. If you invite stakeholders, clarify upfront that they're there to provide context, not to drive the breakdown.
Keep the meeting small. Five to seven people is a practical maximum. Larger groups slow estimation to a crawl.
---
## Pre-Meeting Prep Checklist
Do this before the meeting, not during it. A planning meeting that starts with "let me pull up the requirements" wastes everyone's time.
**For the facilitator:**
- [ ] Read the milestone description or PRD in full. Know the goal, scope boundaries, and open questions.
- [ ] Check the roadmap for dependencies: what does this milestone depend on, and what depends on it?
- [ ] Review team capacity: who is available during this milestone's expected window? Are there upcoming vacations, holidays, or competing priorities?
- [ ] Prepare a rough list of expected items. You don't need to be right, but having a starting list moves the meeting faster than starting from a blank page.
- [ ] Confirm the milestone status in GoalPath is Concept or Inbox before the meeting starts.
**Share with attendees in advance:**
- The milestone description or PRD
- The roadmap context (what this milestone fits between)
- Any relevant research, designs, or technical spikes that inform scope
---
## Meeting Agenda
Target duration: 70 to 90 minutes. Long planning meetings usually mean the scope wasn't ready, not that the team is slow.
---
### 1. Review Milestone Scope and Goals (10 minutes)
Start here, even if everyone has read the PRD. A shared understanding of the goal prevents scope drift later.
**Read the milestone description aloud or display it.** Then ask two questions:
1. "What is this milestone delivering? What will be true when it's done that isn't true today?"
2. "What is explicitly out of scope?"
If you can't answer question two, do it now. Write it down. Ambiguous scope boundaries cause the most planning meeting derailment.
**Common traps to avoid:**
- Jumping into items before confirming the goal. Someone will suggest an item that's out of scope, and you'll spend 10 minutes on a debate that shouldn't happen.
- Letting a stakeholder reopen scope negotiation. If new requirements surface, log them as a note and address them after the meeting. Don't redesign the milestone mid-planning.
---
### 2. Break Down Into Items (20 to 30 minutes)
This is the core of the meeting. Decompose the milestone scope into concrete, independently deliverable items.
**What makes a good item:**
- One person can own it from start to finish
- It has a clear definition of done: you know when it's complete
- It delivers something testable or demonstrable
- It takes less than a week to complete at typical team velocity
**Decomposition techniques:**
Work through the scope area by area. For each area, ask: "What needs to happen for this to work?" Write each answer as a candidate item. Don't filter yet, just generate.
After generating, consolidate duplicates and split anything that feels vague or large. A common mistake is writing items at the epic level: "Build authentication" is not an item. "Add password reset flow" and "Add session expiry handling" are items.
**Item types to consider:**
- **Feature** items: new functionality visible to users
- **Task** items: technical work, infrastructure, migration, or internal tooling
- **Bug** items: known defects to fix as part of the milestone
- **Deadline** items: externally imposed dates, such as a regulatory deadline or launch announcement
Identify each item's type as you create it. In GoalPath, item type is set at creation and affects how it appears in reports and forecasts.
**Time management:** If decomposition is taking longer than 30 minutes, the scope is probably too large or too ambiguous. Stop and ask: should this be split into two milestones?
---
### 3. Estimate Items (15 to 20 minutes)
Estimate after you finish decomposing, not during. Mixing estimation into the breakdown discussion slows both.
**Use Fibonacci story points:** 1, 2, 3, 5, 8.
- **1**: Trivial. A configuration change, a copy edit, a minor UI fix.
- **2**: Small. A straightforward feature with no surprises.
- **3**: Medium. A feature with some complexity or a few moving parts.
- **5**: Large. Multiple components involved, or significant uncertainty.
- **8**: Very large. Consider splitting before you estimate.
**The rule for 8-point items:** Anything that estimates at 8 deserves discussion. Either there is significant complexity that could hide problems, or the item is not well-understood enough to estimate accurately. Ask: "Can we split this?" If you can identify two independent deliverables inside the item, split it.
**Estimation technique:**
Go around the room. Each person gives their estimate independently before you discuss. Say the item name, pause for 5 seconds, then everyone reveals at once (verbally or with cards). If estimates are within one Fibonacci step of each other, take the median and move on. If there's a large spread, the person with the highest estimate explains their concern. Adjust or accept, then move on.
Do not let estimation turn into a design discussion. If you find yourself debating how to build something, log the open question and assign a point estimate based on the simpler interpretation. You can revisit after the meeting.
---
### 4. Identify Dependencies and Ordering (10 minutes)
Review the item list and ask: are any of these blocked by something else?
Two kinds of dependencies matter here:
**Internal dependencies:** Items within this milestone that must happen in sequence. "We can't build the export feature until the data model is migrated." Order those items explicitly.
**External dependencies:** Items that depend on another milestone completing, or on a third party delivering something. Flag these explicitly. An unresolved external dependency is a risk, not a plan.
Assign a priority order to the items. High-priority items should be at the top of the list. The goal is to deliver the highest-value work first, so if the milestone gets cut short, the most important things are already done.
In GoalPath, items are ordered by priority within a milestone. Dragging items into the correct order at this stage makes the board immediately useful.
---
### 5. Assign Ownership and Confirm Capacity (10 minutes)
Go through each item and identify a likely owner. This is not a binding assignment, but it ensures no item is orphaned, and it surfaces capacity problems early.
**Questions to ask:**
- Does the team have the skills to build all of these items? If not, flag it now.
- Does the total estimated work fit within the team's available capacity for this milestone's expected duration?
- Are there items that only one person can build? Single points of dependency are risks worth noting.
Calculate a rough capacity check: multiply the number of expected work-weeks by the team's average velocity. If the total story points in the plan significantly exceed that number, the milestone is over-scoped. Decide now whether to cut scope or extend the timeline. Don't leave the meeting with an unrealistic plan and hope it works out.
---
### 6. Wrap-Up: Confirm Status Change to Planned (5 minutes)
Close the meeting with explicit confirmation:
1. Read back the item list and the total story point estimate.
2. Confirm the execution order.
3. Confirm whether any items are blocked or flagged for follow-up.
4. Change the milestone status from Concept to Planned.
In GoalPath, changing the milestone status to Planned triggers the forecasting system. The milestone will appear on the roadmap with a forecast date range based on team velocity and story points. Review that forecast before you close the meeting: does it match expectations?
If the forecast date is later than expected, this is the right moment to have that conversation, not after two weeks of work have started.
---
## Facilitation Tips
**Separate decomposition from estimation.** The two activities use different parts of the brain. Mixing them produces bad items and bad estimates.
**Defer scope changes.** When someone says "we should also add X," write it down and explicitly set it aside. Say: "Good idea, let's capture that. If it belongs in this milestone, we'll add it. If not, it goes on the backlog." Then move on.
**Time-box estimation.** If a single item is taking more than three minutes to estimate, the item is not well-understood. Assign a provisional estimate, flag it for follow-up, and keep moving.
**Watch for the over-planner.** Some teams plan every item in exhaustive detail before writing a line of code. Planning more than two to three weeks ahead in detail is usually wasted effort. The world changes. Plan what you know, leave room for what you will discover.
**Watch for the under-planner.** Some teams skip estimation entirely and "just start." This produces milestones with no completion signal and forecasts that can't be generated. Rough estimates are enough. Perfect estimates are not required.
---
## Common Pitfalls
**Planning too much at once.** If a milestone requires 200 story points and your team delivers 20 points per week, you're looking at 10 weeks of work. That's a long milestone. Consider whether it should be split into phases.
**Skipping estimation.** Without estimates, there's no forecast. Without a forecast, there's no way to detect drift early. Estimation takes 15 minutes. It is worth it.
**Not identifying dependencies before work starts.** The most common source of mid-milestone blockers is an unresolved dependency that was visible during planning. Catch them here.
**Inviting too many people.** A planning meeting is a working session. Observers slow it down. Keep it to the people who will build the work.
**Treating the plan as fixed.** The plan is a starting point. Items will be added, removed, or re-estimated as work progresses. The planning meeting establishes the baseline, not the final answer.
---
## How GoalPath Handles This
GoalPath doesn't have a dedicated planning meeting UI, but the milestone and item management tools are built around this workflow.
**Milestone status transitions** move through Concept, Planned, In Progress, and Done. Changing to Planned is the signal that planning is complete and forecasting can begin.
**Item types** (Feature, Bug, Task, Deadline) are set at creation and appear in reports and board views. Getting these right during planning saves cleanup later.
**Story point estimates** feed directly into the forecasting engine. Once items are estimated and the milestone is Planned, GoalPath calculates a three-point delivery forecast (optimistic, expected, pessimistic) based on your team's actual velocity.
**Item ordering** within a milestone reflects priority. The highest-priority items appear first. Delivery probability lines show which items are likely to be completed within a given timeframe based on velocity, helping you see at a glance whether the current prioritization makes sense.
**Roadmap dependencies** are visible in the visual roadmap view, which shows how this milestone connects to others in the sequence. Setting up dependencies in GoalPath makes blocking relationships explicit and feeds them into the forecast.
For more on roles during planning, see [Owner](/docs/process/roles/owner) and [Project Leader](/docs/process/roles/project-leader). For the broader process framework, see [Process Framework Overview](/docs/process).
---
Related ceremony: after milestones are planned and in progress, the [Alignment Meeting](/docs/process/ceremonies/alignment-meeting) is where you review progress, resolve blockers, and reorder priorities. Running both ceremonies on a consistent cadence is what keeps delivery on track.
---
#### Alignment Meeting: Facilitator Guide
# Alignment Meeting: Facilitator Guide
The alignment meeting is a structured working session for course correction. It reviews what's happening, surfaces what's stuck, and reorders priorities based on current business value.
It is not a status meeting where people read tickets aloud. The goal is decisions, not updates. GoalPath sends automated progress reports that cover the "where are we" question. The alignment meeting is for the harder question: "what should change about where we are headed."
GoalPath builds this ceremony directly into the product as a six-stage facilitated meeting. This guide explains each stage, what happens in it, and how to facilitate it effectively. The process is also useful without GoalPath, as the structure stands on its own.
---
## Purpose
Teams drift. Work that was the top priority two weeks ago may no longer be the right thing to build. Blockers accumulate quietly. Dependencies shift. Business context changes.
The alignment meeting exists to catch these things before they become expensive. Run it consistently and you surface problems early, when they are still cheap to fix. Skip it and you discover them at the end, when they are not.
A well-run alignment meeting answers three questions:
1. Are we making progress, and is the milestone healthy?
2. Is anything stuck that needs to be unblocked now?
3. Are we still working on the right things in the right order?
---
## Cadence
**Biweekly by default.** Two weeks gives enough time for meaningful change to accumulate between meetings, while keeping the interval short enough to catch drift before it becomes expensive. For most teams in active development, biweekly is the right starting point.
**Monthly for stable teams.** When scope is settled and forecasts are reliable, monthly is enough. If two consecutive alignment meetings produce no reprioritization decisions and no significant escalations, consider moving to monthly.
**Triggered rather than scheduled for mature teams.** Some teams drop the fixed cadence entirely and run alignment only when a specific trigger fires: forecast slipping, scope changed, a stakeholder signal shifted. This requires discipline and a clear shared agreement on what constitutes a trigger.
The alignment meeting is a course-correction ceremony, not a status ceremony. If your meetings are mostly confirming that everything is on track, your cadence is too frequent. Automated progress reports handle the routine "what happened this week" question. Reserve alignment meetings for moments when the answer to that question changes what the team does next.
---
## Who Attends
**A facilitator (anyone on the team)**: Controls stage progression, manages the voting queue, keeps discussion time-boxed. The facilitator does not present work. GoalPath structures the meeting flow, so the facilitation role is lightweight. The Owner provides strategic input and the Project Leader provides technical coordination, but neither has to run the meeting. See [Owner](/docs/process/roles/owner) and [Project Leader](/docs/process/roles/project-leader) for role details.
**Collaborators** (required): Present completed work, raise blockers, flag items needing discussion. These are the people closest to the work. Their input on blockers and escalations is the most important input in the meeting.
**Stakeholders** (required for voting stages): Participate in milestone prioritization voting in Stage 3. Stakeholders do not need to attend the execution-detail stages (Stages 1 and 2), but this is impractical to enforce in most meetings. Cleaner to have them present throughout.
Keep the invite list disciplined. Observers slow voting and inflate the escalation discussion. If someone only needs to see the outcome, share the meeting summary afterward.
---
## Pre-Meeting Prep
GoalPath provides an Alignment Readiness Checklist on the dashboard. Before the meeting, the facilitator should review:
- **Milestone health**: Are any milestones showing AtRisk or Critical status? Know the reason before the meeting starts.
- **Highlighted items**: Are there items flagged as Blocked, Question, or Discussion? These surface in Stage 2. Read them beforehand so you can facilitate informed discussion.
- **Voting queue**: Are there milestones that need priority votes this cycle? Add them to the voting queue before the meeting, not during Stage 3.
- **Roadmap changes**: Have any dependencies shifted since the last alignment meeting? New dependencies or resolved blockers affect the execution order in Stage 4.
- **Recent velocity**: Is the team's throughput stable or has it changed? A sudden velocity drop without an obvious cause is worth flagging.
Five minutes of prep here saves twenty minutes of scrambling during the meeting.
---
## The Six Stages
---
### Stage 1: Progress and Flow Snapshot (10 minutes)
Review completed work and current milestone health.
**What happens:**
The facilitator walks through what was delivered since the last alignment meeting. This is not a round-table where everyone describes their work. It is a look at the data: what moved to Finished or Delivered, what is currently In Progress, and what the milestone health indicators show.
GoalPath surfaces this automatically from real work data. Health indicators:
- **Healthy**: Work is progressing at expected velocity, no significant blockers.
- **AtRisk**: Delivery date is at risk based on current velocity and remaining work. Attention needed.
- **Critical**: Forecast has slipped significantly. Intervention likely required.
- **Stale**: No activity in an unexpected period. The milestone may be deprioritized or blocked without being flagged.
**What to do with health indicators:**
Healthy milestones: acknowledge the progress and move on. Don't spend time on things that are going well.
AtRisk or Critical milestones: note them for Stage 2. These will likely need an escalation discussion.
Stale milestones: ask directly. Is this intentionally parked? Is it blocked? Is it done but not marked as such? Stale is often a data quality issue, not a real problem, but it needs an answer.
**Facilitation tip:** Keep Stage 1 informational. Save discussion for Stage 2. If someone raises a blocker or problem during the progress snapshot, say: "Good, let's capture that for Stage 2."
---
### Stage 2: Flow Health and Escalation (10 to 15 minutes)
Identify blockers, raise escalations, and discuss stuck work.
**What happens:**
GoalPath surfaces items flagged with highlights: Blocked, Question, and Discussion. These are the items that need human attention. Go through each one.
**Blocked**: Something external is preventing progress. The team cannot proceed without resolution. These need an owner and a resolution path before the end of Stage 2. If the block requires a decision from a stakeholder or external team, that escalation happens here.
**Question**: There is an open question about requirements, scope, or approach. The person who raised it is waiting for an answer. Answer it in the meeting or assign a specific person to answer it by a specific date.
**Discussion**: Something needs alignment across the group before work can proceed. These are the most variable: some resolve in two minutes, some require a separate working session. If a Discussion item cannot be resolved in 5 minutes, schedule a separate conversation. Do not let one ambiguous item consume the entire meeting.
**Escalations:**
An escalation is a blocker that the team cannot resolve on their own. Examples: a decision that requires executive sign-off, a dependency on an external team that has stopped responding, a scope question that the product owner has not answered.
Escalations should be raised, discussed, and either resolved or assigned before Stage 2 ends. An escalation that ends Stage 2 without an owner is not resolved, it is deferred.
**Facilitation tip:** Time-box escalation discussions. A blocker that requires more than 5 minutes of discussion in the meeting probably requires its own working session. Say: "This is important. Let's schedule a dedicated conversation and move on."
---
### Stage 3: Business Value Voting (15 to 20 minutes)
Stakeholders and project leaders vote on milestone priorities.
**What happens:**
Milestones in the voting queue are presented one at a time. Participants vote on their business value relative to each other. GoalPath normalizes votes to a 1-100 business value score, which feeds into the roadmap ordering in Stage 5.
**Voting frameworks:**
GoalPath supports multiple frameworks. The facilitator chooses one before the meeting and applies it consistently.
- **RICE**: Rate each milestone on Reach, Impact, Confidence, and Effort. Best for product teams with quantitative user data.
- **MoSCoW**: Must Have, Should Have, Could Have, Won't Have. Best for release planning where you need a clear cutoff.
- **Impact/Effort**: Two-axis prioritization. Quick to run, intuitive for non-technical stakeholders.
- **Weighted Scoring**: Define custom criteria with weights. Best for teams with specific business goals that don't map to generic frameworks.
The framework matters less than consistency. Use the same framework for the same type of decision. Switching frameworks between meetings makes it impossible to compare priorities over time.
**Managing the voting queue:**
The voting queue is where milestones wait before Stage 3. During Stages 1 and 2, if a milestone comes up that should be voted on, the facilitator adds it to the queue without interrupting the current discussion. Stage 3 then processes the full queue.
This prevents Stage 3 from becoming a debate about which milestones to vote on, instead of actually voting on them.
**Facilitation tip:** Stakeholders should vote on business value, not feasibility. If a stakeholder says "I want this one but I'm not sure it's technically possible," that's a Question highlight, not a reason to skip the vote. Vote on the value, then flag the feasibility question for the team.
---
### Stage 4: Visual Roadmap (10 minutes)
Review the dependency map and the impact of this meeting's votes.
**What happens:**
The roadmap view shows how milestones connect: what blocks what, what is downstream of current work, and how the execution order is structured. After voting in Stage 3, this is where you see how the updated priorities affect the sequence.
**Questions to answer in Stage 4:**
- Does the proposed execution order make sense given the dependencies?
- Are there milestones that should be sequenced earlier or later based on what just surfaced in Stages 1 and 2?
- Are there dependency loops or bottlenecks that need attention?
- If we reprioritize milestone X, what does that do to milestones Y and Z downstream?
**"What if" scenarios:**
The roadmap view lets you explore hypothetical reorderings before committing to them. This is the right time to test assumptions: "If we delay the API migration milestone, does the mobile release milestone still land before the Q3 deadline?" Answer it here, not in a Slack thread after the meeting.
**Facilitation tip:** Keep Stage 4 visual. Don't narrate the roadmap line by line. Point to specific milestones and dependencies that are relevant to decisions made in Stages 2 and 3. Most of the roadmap should already be familiar to attendees.
---
### Stage 5: Roadmap Update (5 minutes)
Apply the business value sorting and confirm the execution order.
**What happens:**
Take the votes from Stage 3 and apply them. GoalPath sorts milestones by their normalized business value score, updating the roadmap ordering automatically. The facilitator then confirms:
- Is the resulting execution order correct, given the dependencies surfaced in Stage 4?
- Are there manual adjustments needed? (For example, a high-value milestone that cannot start yet because it depends on an in-progress milestone.)
- What is the agreed execution priority for the next period?
**What "confirmed" means:**
The roadmap update is the formal output of the meeting's prioritization work. It is what the team will execute against until the next alignment meeting. Everyone leaves with the same picture of what is being worked on and in what order.
This is also the moment to surface any milestones that should move to the Icebox: work that has been consistently deprioritized and is unlikely to happen in the near term. Parking it explicitly is cleaner than letting it sit at the bottom of the roadmap indefinitely.
**Facilitation tip:** Stage 5 should be fast. If Stage 3 voting was done well, Stage 5 is just a confirmation, not a new negotiation.
---
### Stage 6: Decisions and Summary (5 to 10 minutes)
Document decisions, capture meeting notes, and close.
**What happens:**
Review the decisions made in the meeting:
- Which escalations were resolved, and how?
- Which milestones received new priority scores?
- What is the confirmed execution order for the next period?
- What follow-up actions were assigned, and to whom?
Write these down. A meeting where decisions were made but not recorded is a meeting that will have the same conversation next time.
GoalPath's notes panel is available throughout the meeting for capturing decisions in real time. After the meeting, an AI-generated summary can be produced from the meeting content and shared with attendees or stakeholders who weren't present.
**Closing questions:**
Before adjourning, ask:
1. "Is there anything from today that should be flagged as a blocker or question in GoalPath?"
2. "Is there anything we decided today that changes the scope or status of a milestone?"
3. "When is the next alignment meeting?"
The last question matters. If the next meeting is not scheduled before this one ends, it often doesn't get scheduled at all.
---
## Facilitation Tips
**Time-box each stage.** The time estimates are targets, not suggestions. When a stage runs long, it is usually because the discussion is not producing a decision. Name that: "We're spending a lot of time on this. What decision do we need to make?"
**Use the voting queue to protect stages 1 and 2.** When a milestone comes up in the progress or escalation discussion that also needs a priority vote, add it to the queue and move on. Don't interrupt the flow to vote mid-discussion.
**Keep escalation discussions focused.** An escalation discussion that doesn't produce an owner and a resolution path is not a discussion, it is a complaint. Push for: "Who owns this, and by when will it be resolved?"
**The facilitator does not present work.** If the facilitator is also working on items, they step out of the facilitator role to report on that work, then step back in. Mixing the roles in one breath causes confusion.
**Don't skip the roadmap stage.** Teams under time pressure often drop Stage 4 to save time. This is where the integration happens: voting results, dependency context, and execution order all come together. Skipping it means the voting work doesn't connect to what the team actually does next.
---
## How GoalPath Handles This
The alignment meeting is built into GoalPath as a first-class feature. The facilitator controls the stage progression from within the product.
**Stage flow:** GoalPath guides the meeting through all six stages. The facilitator advances each stage. A timer tracks elapsed time per stage.
**Health indicators:** Progress Snapshot (Stage 1) data is drawn directly from milestone and item activity. There is no manual input required. The health status reflects actual work, not self-reported estimates.
**Highlighted items:** Items flagged with Blocked, Question, or Discussion appear automatically in Stage 2. Collaborators set highlights on items throughout the period between meetings. The meeting surfaces what has accumulated.
**Voting system:** GoalPath normalizes votes across participants and frameworks to a consistent 1-100 business value score. This allows votes from different frameworks (or different participants who might weight criteria differently) to be combined into a single comparable score.
**Voting queue:** Milestones can be added to the voting queue during any stage by the facilitator. This prevents the meeting from losing flow while ensuring nothing gets missed.
**Notes panel:** Available throughout the meeting for capturing decisions in real time. After the meeting, a summary can be generated from the notes and shared.
**Meeting output:** The confirmed roadmap order, resolved escalations, and assigned actions from the meeting feed into velocity calculations and upcoming progress reports automatically. The alignment meeting is not a sidecar to GoalPath. It is part of the execution loop.
For the broader process framework, see [Process Framework Overview](/docs/process). For role details, see [Owner](/docs/process/roles/owner) and [Project Leader](/docs/process/roles/project-leader).
---
Related ceremony: milestones need to be planned before they can be meaningfully reviewed in an alignment meeting. See the [Milestone Planning Facilitator Guide](/docs/process/ceremonies/milestone-planning) for how to move a milestone from Concept to Planned with a full item list and estimates in place.
---
#### Roadmap Planning: Facilitator Guide
# Roadmap Planning: Facilitator Guide
Roadmap planning is not the same as milestone planning. Milestone planning breaks down a defined piece of work into items. Roadmap planning asks whether you are building the right things in the right order. One is execution. The other is direction.
Most teams blur this distinction. They hold a quarterly planning session and walk through a list of features, estimate each one, and call it a roadmap. What they end up with is a prioritized backlog, not a strategic plan. The result is a team that ships consistently but drifts from its goals.
The GoalPath process treats roadmap planning as a distinct ceremony with a specific output: a sequence of milestones ordered by business value, with clear dependencies and realistic target dates based on actual team velocity.
---
## When to Run Roadmap Planning
Quarterly is the default cadence. Most teams need to recalibrate every three months, even when things are going well. Markets shift, priorities change, and what looked important in January often looks different by April.
Run a roadmap planning session outside the quarterly cycle when:
- A major pivot happens and the current plan no longer reflects the company's direction
- The team completes milestones faster than expected and runs out of well-defined work
- External circumstances shift priorities significantly (a competitor ships, a key customer churns, funding changes)
- The roadmap has grown so large or tangled that nobody on the team can explain what comes next and why
If you're running roadmap planning more than once per quarter without an obvious trigger, the problem is usually unclear ownership, not planning cadence.
---
## Who Attends
**Owner facilitates.** The Owner controls the roadmap structure and is accountable for strategic alignment. They run the meeting, keep the agenda moving, and make the final call when the group can't reach consensus.
**Project Leaders participate.** They bring milestone-level context: what's in progress, what's blocked, what's harder or easier than expected. They vote on priorities and shape the dependency structure.
**Stakeholders participate.** They bring business context: customer feedback, market signals, revenue impact, and the goals the roadmap is supposed to serve. Without Stakeholders in the room, roadmap planning tends to drift toward technical preference.
**Collaborators are optional.** Invite them when feasibility input is needed, particularly when dependencies between milestones are unclear or when specific technical constraints should inform the sequencing. They should not vote on business priorities.
---
## Pre-Meeting Preparation
The Owner prepares before the session. Walking into roadmap planning without this context wastes everyone's time.
**Gather current roadmap state:**
- Which milestones are Done since the last planning session
- Which milestones are In Progress and where they stand
- Which milestones are Planned but not yet started
- Any milestones added to Inbox or Icebox that have not been placed yet
**Pull velocity data:**
- Team velocity over the last 6 weeks (GoalPath calculates this automatically)
- Multitasking load: how many milestones are running in parallel
- Forecast accuracy from the previous quarter: did estimates hold?
**Collect external inputs:**
- Customer feedback themes from support, sales, or success
- Competitive changes: what did competitors ship?
- Business goal status: which goals are on track, which are falling behind?
- Any external deadlines (conferences, contract renewals, regulatory dates)
Send a brief pre-read to attendees 24 hours before the session. Include the current roadmap state and velocity data. Do not send proposed priorities before the meeting. You want people to arrive with context, not anchored to someone else's ranking.
---
## Meeting Agenda (90-120 minutes)
### 1. Review Current Roadmap and Progress (15 min)
Walk through the roadmap together. The goal is shared reality before any decisions are made.
Cover:
- What shipped since the last planning session
- What is currently in progress and where each milestone stands
- What changed since last quarter (scope additions, deprioritizations, pivots)
- Whether forecasts from last planning held up, and if not, why
Keep this factual. This is not a performance review. It is context-setting. If there are blockers or health issues, name them and move on. This meeting is about the plan, not the postmortem.
### 2. Strategic Context (15 min)
Before touching the roadmap, align on what you are trying to accomplish. This step is easy to skip and almost always worth doing.
Each Stakeholder shares:
- The business goals that matter most right now
- Customer feedback themes from the past quarter
- Any competitive or market changes that affect priorities
The output of this step is a short list of strategic priorities, stated plainly. "Win enterprise customers in the healthcare sector." "Reduce churn in the first 30 days." "Ship the mobile app before the conference in June." These should drive the session.
If the team cannot name 2-3 clear strategic priorities, stop here. Roadmap planning without clear goals is just list management.
### 3. Reverse Planning (30 min)
This is the core of the session. Start from the goals established in step 2 and work backwards.
The question to ask for each goal: "What do we need to accomplish to reach this?" Create milestones that answer that question directly. Then ask the same question of each new milestone: "What needs to be true before we can deliver this?" This process creates a natural dependency tree.
Working backwards is important because it forces discipline. When you plan forwards from a list of feature ideas, everything seems equally plausible. When you plan backwards from a goal, it becomes obvious which milestones are necessary and which are optional.
The facilitator runs this live on the roadmap. Create milestones, draw dependencies, ask the group: "Is there anything else needed to get from here to the goal? What are we assuming?"
Capture open questions as you go. If the group disagrees about whether a milestone is necessary, note it and move on. Resolve it at the end, not in the middle of the dependency mapping exercise.
GoalPath's visual roadmap is the right canvas for this. Use it during the session. The dependency graph shows which milestones block others, and the goal path makes the chosen sequence explicit.
### 4. Priority Voting (20 min)
Once the milestone set is clear, the group votes on business value. GoalPath supports business value voting with automatic normalization.
The voting question: "How much business value does this milestone deliver relative to the others on this roadmap?"
Each voter distributes points across milestones. GoalPath normalizes the scores so one person's generous voting doesn't dominate. The result is a ranked list of milestones by collective business value judgment.
After voting, look at the ranking. Does it match intuition? If a milestone ranked high surprises people, or if one ranked low seems obviously important, dig into the discrepancy. Voting surfaces hidden assumptions. The discussion after voting is often more valuable than the scores themselves.
### 5. Sequence and Commit (15 min)
Combine two inputs to build the execution sequence:
1. Business value ranking from the vote
2. Dependencies from the reverse planning exercise
Milestones that are both high-value and unblocked by dependencies go first. Milestones that are valuable but blocked by prerequisite work get scheduled after their dependencies. Milestones that are low-value and have no urgency get pushed out or moved to Icebox.
Apply current team velocity to set realistic target dates. If the team completes 30 story points per week and the next three milestones total 180 points, that is roughly six weeks of work, not three.
Identify the critical path: the sequence of dependent milestones where a delay in any one delays all those that follow. Name it explicitly. The critical path gets prioritized above everything else.
At the end of this step, the roadmap should show a sequence that the room agrees is achievable and strategically correct.
### 6. Communicate the Plan (10 min)
Before the session ends, decide how to share the updated roadmap.
Who needs to know about changes? Leadership, the full team, external partners? What format is appropriate: a written summary, a roadmap share link, a presentation?
Assign someone to own the communication. Do not leave it as a group responsibility or it will not happen.
---
## The Reverse Planning Technique
Reverse planning is worth explaining in more detail because it runs counter to how most teams are trained to think about planning.
Forward planning starts from a list of things to build and asks: how long will each take? This tends to produce a backlog that is internally coherent but strategically incoherent. The team delivers consistently, but the connection between what they ship and what the business needs is weak.
Reverse planning starts from a goal and asks: what needs to be true for this goal to be achievable? Then it asks the same question of each answer, recursively, until it reaches work that can start today.
The process naturally produces a dependency graph. If goal G requires milestone M3, and M3 requires M2, and M2 requires M1, the team has a clear critical path without ever discussing sequencing explicitly. The sequencing falls out of the dependency structure.
Reverse planning also surfaces scope that does not need to exist. If a proposed milestone cannot be connected to any goal through a dependency chain, it should be questioned. Either the goal is missing from the list, or the milestone is not actually necessary.
GoalPath's roadmap view renders this dependency graph visually. After a reverse planning session, the roadmap shows the goal path from current work to strategic outcomes. The dependency arrows trace the logic. Any milestone that floats disconnected from the graph is a signal worth investigating.
---
## How GoalPath Handles This
GoalPath provides direct support for the roadmap planning ceremony.
**Visual dependency graph.** The roadmap shows milestones and goals as nodes with dependency arrows between them. The reverse planning exercise runs live on this canvas. Create milestones, connect them, and see the structure take shape in real time.
**Business value voting.** GoalPath's voting feature lets each eligible participant score milestones. Scores are normalized automatically so relative rankings are stable across participants who vote differently in absolute terms.
**Execution ordering.** GoalPath combines the business value ranking with the dependency graph to calculate an execution order. Milestones on the goal path are sequenced by value, constrained by dependencies. The critical path is visible.
**Milestone forecasting.** After sequencing, GoalPath applies current team velocity to each milestone and generates three-point delivery forecasts: optimistic, expected, and pessimistic. These are based on actual completed work, not estimates provided at the start of the project.
**Goal path filter.** During planning, the goal path filter shows only the milestones committed to the current strategy. Off-path milestones remain on the roadmap but are visually separated, making it clear what is a commitment and what is a possibility.
For a detailed explanation of how GoalPath calculates forecasts, see [Understanding Project Forecasts](/docs/features/velocity-tracking). For the visual roadmap and dependency graph features, see [Visual Roadmap](/docs/features/visual-roadmap).
---
## Related Ceremonies
- [Milestone Planning](/docs/process/ceremonies/milestone-planning): Breaks a planned milestone into items with estimates
- [Alignment Meeting](/docs/process/ceremonies/alignment-meeting): Regular check on forecast and scope decisions
- [Retrospective](/docs/process/ceremonies/retrospective): End-of-milestone process review
See also: [The GoalPath Development Process](/docs/process) for the full framework overview.
---
#### Daily Standup Guide
# Daily Standup Guide
The standup has one job: keep the team aligned on what is happening, what is blocked, and what comes next. That is it.
It is not a status report to a manager. It is not a problem-solving session. It is not optional when the team is heads-down. The daily cadence is the point. A team that skips standups when "nothing is happening" is a team that will consistently be surprised when something is.
Fifteen minutes. Same time every day. Structured format so it does not drift.
---
## Sync vs. Async
Both work. Neither is inherently superior. The choice depends on how the team operates.
**Synchronous standup:** The team meets, live or over video, at a fixed time. Works well for co-located teams or teams with significant time zone overlap. The social layer of a live standup, picking up on tone and energy, is real and has value.
**Asynchronous standup:** Each team member updates their status in GoalPath during their morning, before their first focus block. The team lead reviews highlights and blockers and posts any follow-ups. Works well for distributed teams with wide time zone spreads.
Async standups lose the social signal. Sync standups require coordination. Most teams with tight overlap benefit from sync. Most teams spanning more than four time zones benefit from async. Hybrid teams can do both: async for daily updates, sync for the weekly version with everyone present.
Regardless of format, the four stages stay the same.
---
## The Four Stages
GoalPath's standup feature runs through four stages in sequence. Whether the team runs sync or async, this structure keeps the session focused.
### Stage 1: Inbox (2 min)
Review any unplanned items added since the last standup. Every item that arrived without being part of the current milestone plan gets surfaced here.
The question for each item: does this belong in the current scope, or does it get deferred?
This is a triage decision, not a planning session. Assign a triage priority: Incident (respond now), Expedite (next available slot), Standard (work it in normally), Deferred (acknowledge and park). Do not debate scope or estimate effort at this stage.
If there are many inbox items, that is a signal worth noting, not a reason to extend the standup. High inbox volume belongs in the next alignment meeting, where there is time to address it properly.
### Stage 2: Highlighted Items (3-5 min)
Review items with active highlights: Blocked, Question, or Discussion.
These items need attention. Someone is stuck, a requirement is unclear, or a decision is pending that cannot wait. Go through each highlight and assign it to someone. Who is unblocking this? Who answers the question? Who is involved in the discussion?
The standup does not resolve blockers. It assigns them. The resolution happens offline, between the people who can actually move the item forward.
If a blocker has been open for more than two standups and is not progressing, that is worth naming. A blocker that nobody is actively addressing is not a blocker: it is a delay in disguise.
### Stage 3: Team Members (5-10 min)
Each person on the team covers three things:
1. What did I finish since the last standup?
2. What is blocking me right now?
3. What am I working on next?
GoalPath shows each team member's current assigned items. The check-in uses that view directly. No verbal summary of a list that's already on screen. Point at the item, note the state, flag anything that needs attention.
Keep each person to two minutes or less. If someone needs more time to explain a blocker or handoff, take it offline. Note absent team members and who is covering their critical items if anything is time-sensitive.
The peer-to-peer orientation matters. Team members are not reporting up. They are synchronizing with each other. The facilitator's role during check-in is to keep time and note dependencies between people's work, not to evaluate or direct.
### Stage 4: Let's Get Going (1 min)
Confirm priorities. Is what everyone said they are working on actually the highest-value next step? Are there dependencies between people that should be coordinated before the session ends?
Then close. "Go build" is a complete sentence.
---
## Time-Boxing
Fifteen minutes total. That is the budget.
If a topic needs more than two minutes, it gets taken offline. The standup is not the place to solve a technical problem, hash out a requirement, or conduct a code review. Those conversations are valuable and should happen. They should not happen in the standup.
The discipline of a short standup is not about the time. It is about the signal it sends: the team respects each other's focus time enough not to extend a daily sync beyond what it needs to be.
GoalPath's standup interface includes a timer. Use it.
---
## Common Standup Anti-Patterns
**Status reporting to the manager.** When team members direct their check-in at the most senior person in the room, it signals a management dynamic that undermines peer coordination. The standup is for the team. If the manager is in the room, they check in like everyone else.
**Problem-solving in the standup.** "I'm blocked on the API integration" should produce "talk to Priya after this" in the standup, not a ten-minute technical discussion. The standup identifies problems. The team solves them elsewhere.
**Skipping because nothing happened.** "I don't have an update today" is still an update. The cadence is the point. A team that shows up every day, even when nothing is changing, is a team that catches drift early.
**Rehashing yesterday.** The check-in should move forward. What is done, what is blocked, what is next. Extended discussion of completed work belongs in a review or retrospective.
**Running without the data.** Standing up without looking at the actual items tends to produce vague updates that are not actionable. GoalPath's standup view is designed to run alongside the meeting, not as a pre-read that people glance at the night before.
---
## How GoalPath Handles This
GoalPath has a built-in standup feature that structures the four stages as a guided flow.
**Standup view.** The interface walks through Inbox, Highlighted Items, Team Members, and Let's Get Going in sequence. Each stage surfaces the relevant data automatically, so the facilitator does not need to pull information from separate views.
**Team-specific standups.** Projects with multiple teams run separate standups per team. Each team sees only their items, their inbox, and their highlights. Cross-team blockers surface as highlights and get escalated to the next alignment meeting.
**Per-member tracking.** GoalPath shows each team member's current assigned items during check-in. Items move through status transitions during the standup itself: mark something Finished, mark the next thing Started, right in the interface.
**Absent tracking.** Mark team members as absent for the session. Their items remain visible so the team can identify coverage gaps.
**Notes panel.** Capture decisions, action items, or follow-ups during the standup. Notes are attached to the session and visible after the meeting ends.
**Timer.** A visible timer counts the session. Keeps the facilitator honest about pace without requiring manual timekeeping.
---
## Related Ceremonies
- [Roadmap Planning](/docs/process/ceremonies/roadmap-planning): Quarterly strategic planning session
- [Alignment Meeting](/docs/process/ceremonies/alignment-meeting): Regular stakeholder sync on forecast and scope
- [Retrospective](/docs/process/ceremonies/retrospective): End-of-milestone process review
See also: [The GoalPath Development Process](/docs/process) for the full framework overview.
---
#### Retrospective: Facilitator Guide
# Retrospective: Facilitator Guide
The retrospective is the only ceremony focused entirely on the process itself, not the work. Every other meeting addresses what you are building or where you stand. The retrospective asks: how does the team work, and how do you make it better?
Done well, a retrospective produces 1-3 concrete process changes that the team acts on in the next milestone. Done poorly, it produces a list of complaints that nobody follows up on, and a growing skepticism that retrospectives are worth the time.
The difference is usually structure and follow-through, not the quality of the discussion.
---
## Cadence
Run a retrospective weekly, per team. Same cadence as the rest of the process. A weekly retro keeps the feedback loop tight: the team reflects on what happened this week while it is fresh, and adjusts before the same problems repeat next week.
Weekly retros work because each week produces enough shared experience to discuss. The team shipped items, hit blockers, made trade-offs. A week is enough time for patterns to emerge but short enough that the team remembers the details.
If your team is very small (two or three people), biweekly may be enough. But err toward weekly. Accumulated friction compounds faster than most teams expect.
---
## Who Attends
Everyone who worked on the milestone attends. This includes Collaborators who were active contributors, the Project Leader who facilitated milestone planning and alignment meetings, and the Owner if they were involved in day-to-day decisions.
The Project Leader or Owner facilitates. Having an outside facilitator is useful when there is known tension in the team, but it is not necessary for a healthy team running a routine retrospective.
Stakeholders are welcome but not required. If Stakeholder decisions or changes significantly affected the milestone, their presence can add useful context. If the retrospective is primarily about internal team dynamics and execution, Stakeholder presence can inhibit candid discussion.
---
## Format Options
The format determines what kind of data the team surfaces. Choose one format and run with it. Do not mix formats in the same session: it creates confusion and tends to produce shallow results across too many dimensions.
### Start / Stop / Continue
The most common retrospective format. Simple to run, easy to explain, works for most teams.
Three columns:
- **Start:** What should we begin doing that we are not doing now?
- **Stop:** What should we stop doing that is not serving us?
- **Continue:** What is working and should be protected?
Each person writes items silently before sharing. Group similar items. Vote on the top three across all columns combined.
Start/Stop/Continue works well for teams that need a broad view of what is and is not working. It tends to produce actionable output because the framing forces a behavioral orientation.
### 4Ls
A format that emphasizes learning alongside action.
Four prompts:
- **Loved:** What did you genuinely love about how this milestone went?
- **Learned:** What did you learn that you did not know before?
- **Lacked:** What did the team or the process lack that would have helped?
- **Longed for:** What did you wish you had, wish had gone differently, or wish existed?
4Ls produces richer qualitative data than Start/Stop/Continue. It is particularly useful after a difficult or unusual milestone where the team needs to process what happened before jumping to changes. The "Loved" prompt also serves as a deliberate counterweight to the tendency of retrospectives to skew negative.
### Timeline Retrospective
Walk through the milestone chronologically. Draw a horizontal timeline. Team members mark key events: decisions, surprises, breakthroughs, frustrations. Rate each event with a high, neutral, or low marker.
After building the timeline together, identify patterns: where did energy drop? Where did things accelerate? What were the turning points?
The timeline format works well when the milestone had a complex or eventful history that a simple prompt-based format would flatten. It is more time-consuming than the other formats but produces the most detailed shared picture of what actually happened.
Use the timeline format after a milestone that went significantly off track, had a notable incident, or where the team's experience differed substantially across members.
---
## Meeting Agenda (50-60 minutes)
### Set the Stage (5 min)
Orient the group. What milestone are you reflecting on? Briefly review the milestone's scope and its outcome: what did it set out to do and what did it actually deliver?
Name the format being used and explain the rules:
- Everything said in this room stays in this room
- The goal is process improvement, not individual critique
- One person speaks at a time
- The facilitator keeps time
This step is short but important. Teams that skip it tend to lose the first ten minutes to setup confusion and scope arguments.
### Gather Data (15 min)
This is the silent brainstorming phase.
Give each person 7-10 minutes to write their responses to the chosen format. Individually, in silence. No discussion yet.
After the silent period, each person shares what they wrote. The facilitator captures items on a shared surface: a whiteboard, a shared doc, or any visible format. Group similar items as they emerge.
The silent start matters. Without it, the first person to speak shapes the room's perception, and quieter team members tend to anchor on what was said rather than what they actually think.
### Generate Insights (15 min)
Look at what the group produced. What themes emerge? What surprises? What does the group agree on without needing discussion?
Vote on the top issues. Each person gets three votes and can distribute them however they want. Items with the most votes are the ones the team cares most about improving.
Discuss the top three. The goal of this phase is to go from "a thing happened" to "here is why it happened and what conditions produced it." Surface the root cause, not just the symptom.
A useful question here: "Has this happened before?" Recurring issues deserve more weight than one-time events.
### Decide Actions (10 min)
Pick 1-3 concrete changes for the next milestone. Not aspirations. Not general improvements. Specific, observable changes: "We will estimate all items before milestone planning ends" or "Blockers get assigned at standup, not mentioned and left open."
For each action:
- State it as a behavioral change, not a goal
- Assign one person as owner
- Define how the team will know it is being done
The facilitator records these actions. They become Task-type items in the next milestone, assigned to the appropriate owner. If they do not live somewhere trackable, they will not happen.
Do not leave this step with more than three actions. Three focused changes that the team actually implements are worth more than ten changes that get forgotten by the following week.
### Close (5 min)
Acknowledge the work done in the milestone. This does not need to be elaborate. A sentence or two from the facilitator naming what the team accomplished and what it took is enough.
Ask each person to name one thing they are taking away from the retrospective. This final round creates closure and gives the facilitator a quick read on whether the session landed.
---
## Key Principle: Psychological Safety
Retrospectives only work if people feel safe being honest.
A team that hedges, deflects blame, or avoids naming real problems in a retrospective is a team that has learned it is not safe to tell the truth in that room. That is usually a function of how leadership responds to candid feedback. If past honesty was punished, ignored, or used against someone, people will stop being honest.
The facilitator's job is to model the norm: the conversation is about the process, not the people. When a recurring bug or a missed deadline comes up, the question is "what in our process allowed this to happen?" not "who is responsible for this?"
Blaming the process is not avoiding accountability. It is directing attention at what can actually be changed. Individual performance issues are a separate conversation that happens in a different setting.
If the team is new to retrospectives, or if there has been recent tension, start with a lighter format like Start/Stop/Continue. Build the habit of candid discussion before moving to formats that surface deeper issues.
---
## How GoalPath Handles This
Retrospectives do not yet have a dedicated tool feature in GoalPath. The ceremony runs as a facilitated meeting using any available tooling for the format.
What GoalPath provides is the data that grounds the conversation.
**Milestone health history.** The health indicators captured during the milestone, WIP warnings, multitasking penalties, blocked items, and forecast changes, form a factual timeline of how the milestone progressed. Use this as a starting point before the team adds qualitative experience.
**Velocity and flow metrics.** Velocity trends, planned vs. unplanned work ratios, and flow distribution from the analytics view show what the numbers say about the milestone. Bring these into the session to prevent retrospectives from operating purely on memory and feeling.
**Blocker history.** Items that carried a Blocked highlight during the milestone are visible in the item history. Review these before the session to understand where the team got stuck and for how long.
**Progress reports.** GoalPath's automated weekly reports document the milestone's week-by-week progress. These function as a timeline reference without requiring the team to reconstruct what happened from memory.
**Action items as tasks.** After the retrospective, create the decided actions as Task-type items in the next milestone. Assign owners, add to the backlog, and track completion like any other work. This is the step that separates retrospectives that change things from retrospectives that produce a list nobody reads.
---
## Related Ceremonies
- [Alignment Meeting](/docs/process/ceremonies/alignment-meeting): Regular team and stakeholder sync
- [Standup](/docs/process/ceremonies/standup): Daily team sync
- [Milestone Planning](/docs/process/ceremonies/milestone-planning): Breaking down a new milestone into items
- [Roadmap Planning](/docs/process/ceremonies/roadmap-planning): Quarterly strategic planning session
See also: [The GoalPath Development Process](/docs/process) for the full framework overview.
---
#### Automation and Principles
# Automation and Principles
The goal is not to replace human judgment. The goal is to automate the facilitation work so humans can focus on the judgment calls.
A scrum master spends most of their time on logistics: scheduling standups, tracking velocity, preparing sprint reviews, maintaining the board, generating status reports. These are real costs. They add up. And they rarely require the scrum master's actual expertise. GoalPath handles the logistics. The judgment calls stay with the team.
## What GoalPath Automates
### Velocity Tracking
Velocity is calculated weekly from completed work. The unit is story points per week, measured over a rolling six-week window.
One nuance: multitasking has a cost. When one person works on multiple items simultaneously, context switching reduces effective output. GoalPath accounts for this by adjusting estimates using a square root formula. An item estimated at 4 points, shared equally between two owners, contributes 4 / sqrt(2) points to each person's velocity calculation. This produces more accurate throughput data than treating shared items as full credit for each owner.
The six-week window is long enough to smooth noise and short enough to reflect recent changes in team composition or pace. If velocity shifts materially, forecasts update immediately.
### Delivery Forecasting
Forecasts run Monte Carlo simulations using real velocity data. The result is a three-point estimate: optimistic, expected, and pessimistic delivery dates.
The simulation draws from the team's actual throughput distribution, not from capacity planning assumptions. A team that finishes three items one week and eight the next has higher variance than a team that consistently finishes five. The simulation captures that variance and reflects it in the range between optimistic and pessimistic outcomes.
Forecasts update automatically as work completes. No spreadsheet math. No manual burndown charts to maintain.
### Progress Reports
Progress reports are generated weekly from milestone activity. The structure is consistent: what shipped, what is in progress, what is blocked, and how the forecast changed.
When meaningful activity is detected, a narrative summary accompanies the structured data. When the week was quiet, the report shows the table without narrative. The goal is to give stakeholders accurate information without requiring anyone to write a status update.
Reports support multiple languages. Teams working across regions can generate the same report in each stakeholder's language without additional effort.
### Milestone Health Monitoring
Each milestone receives a weekly health assessment: Healthy, At Risk, Critical, Stale, or Insufficient Data.
Health is assessed from three signals: velocity trends over the past six weeks, work completion rate relative to scope remaining, and forecast trajectory relative to the milestone target date. A milestone burning through scope faster than the team delivers is flagged At Risk before it becomes Critical. Stale milestones, where no work has moved in several weeks, are flagged separately.
The health indicator surfaces on dashboards and in reports. Teams that monitor health weekly catch problems earlier than teams that notice them when the deadline arrives.
### Meeting Facilitation
Alignment meetings run through six structured stages: Progress and Flow Snapshot, Flow Health and Escalation, Business Value Voting, Visual Roadmap, Roadmap Update, and Decisions and Summary. Each stage has a built-in timer and a notes section. Stage progression is explicit, not ad-hoc.
Standup meetings run through four stages: Inbox, Highlighted Items, Team Members, and Let's Get Going. Same structure: timer, notes, explicit stage transitions.
The structure is not there to constrain the conversation. It is there so the team does not have to spend time deciding what to cover. The agenda is built into the tool.
### Priority Normalization
Business value voting supports multiple scoring frameworks: RICE, MoSCoW, Impact and Effort, and Weighted Scoring. Different frameworks weight criteria differently. To compare results across frameworks, voting output is normalized to a 1-100 score.
This makes it possible to look at a backlog and see relative priority regardless of which framework produced the score. The normalization is automatic. Teams get comparable numbers without converting between frameworks manually.
### WIP Visibility
The dashboard surfaces current work in progress across the team. Items that have not moved recently are flagged. Flow health indicators show whether the team is pulling work steadily or accumulating bottlenecks.
This is monitoring, not enforcement. GoalPath does not block work or impose hard WIP limits. It shows what is happening so the team can decide what to do about it.
## What Stays with Humans
Automation handles the logistics. These decisions stay with the team:
**Scope decisions.** What to build, what to defer, what to cut. GoalPath provides forecast data to inform scope decisions. It does not make them.
**Priority trade-offs.** Business value voting produces data: scores, rankings, team input. The final call belongs to the people who understand the business context, customer relationships, and strategic bets involved.
**Blocker resolution.** GoalPath surfaces blocked items. Resolving blockers requires understanding why they are stuck, which is always a human problem: dependencies, unclear requirements, external teams, technical unknowns.
**Estimation.** The team estimates. GoalPath tracks accuracy over time. Point inflation, optimism bias, and calibration are team dynamics, not algorithmic problems.
**Architecture and technical decisions.** Nothing in GoalPath touches these. Technical judgment belongs to the people doing the technical work.
**Stakeholder relationships.** Progress reports provide accurate information. Navigating how that information lands with different stakeholders is a relationship problem.
## Underlying Principles
### Weekly Cadence
All automated operations run on Sunday. The working week runs Monday to Sunday, following ISO week numbering. Velocity is calculated, health is assessed, and reports are generated at the end of each week.
A fixed weekly cadence provides predictability without ceremony overhead. There is no debate about sprint length. There is no sprint boundary negotiation. The week ends, the data updates, and the next week begins.
### Flow Over Ceremonies
The test for any process element is whether it moves work forward or just accounts for it. GoalPath minimizes time in meetings and maximizes time building. Ceremonies that add structure without adding information are replaced with automated reporting. Ceremonies that require human judgment, like retrospectives and priority discussions, are structured but kept short.
### Visibility Over Control
GoalPath monitors work in progress, velocity, and milestone health. It does not enforce WIP limits, block sprint changes, or gate releases. The philosophy is that teams with good information make better decisions than teams working under process constraints they did not choose.
This is a deliberate choice. Hard limits create workarounds. Visibility creates accountability. Accountability tends to produce better behavior than enforcement.
### Data Over Opinions
Delivery forecasts come from throughput data, not from how confident the team feels. Velocity comes from actual completions, not from capacity planning assumptions. Health assessments come from trend analysis, not from manager intuition.
This does not mean data is always right. It means the data gives the team something concrete to argue with. "The forecast shows four weeks but I think we can do it in two" is a more productive conversation when both sides have the same underlying numbers.
### Process in the Tool, Not in a Wiki
The workflow is in the interface. There is no separate process documentation to maintain, no onboarding videos to watch, no process police to follow up. New team members encounter the process by using the tool. Standup runs the same way for everyone because the tool runs it the same way for everyone.
This reduces process drift. Teams following a documented process gradually diverge from it. Teams using a tool-embedded process cannot diverge as easily.
## The Scrum Master Question
GoalPath does not replace a scrum master entirely. It replaces the logistics a scrum master handles.
A scrum master's logistics work includes: tracking velocity, preparing sprint reviews, maintaining the board, generating status reports, facilitating structured meetings, and running retrospectives. GoalPath automates these. For many teams, this is the majority of what they needed a scrum master for.
What GoalPath does not replace: coaching individuals through performance problems, navigating team conflict, managing organizational relationships, running change management processes, and building team culture deliberately.
For teams of five to twenty people, the logistics automation is often enough. The team lead takes on the judgment-heavy coaching work. The facilitation overhead disappears into the tool. The team spends more time building.
If you need dedicated coaching and organizational navigation, GoalPath does not replace that. If you need the reporting, tracking, and meeting structure handled automatically, it does.
---
See also: [Process Framework overview](/docs/process) for context on how these pieces fit together, and the ceremony pages for details on [alignment meetings](/docs/process/ceremonies/alignment-meeting) and [standups](/docs/process/ceremonies/standup).
---
#### Framework Comparison
GoalPath does not invent a new methodology. It takes proven practices from Scrum, Kanban, and lean development and embeds them in the tool. The result is a lighter workflow for teams that know these concepts but do not want the overhead of running them from scratch.
This page explains where GoalPath aligns with existing frameworks, where it differs, and why.
## GoalPath and Scrum
Scrum is the most common reference point for teams adopting GoalPath. The lineage is intentional and visible.
### What GoalPath borrows from Scrum
- Iterative development within time-boxed periods
- Velocity tracking from story point estimates
- Planning ceremonies as team-wide alignment events
- Daily standups for work visibility and coordination
- Retrospectives for continuous process improvement
- Defined roles with clear responsibilities
GoalPath's role structure maps closely to Scrum: Owner corresponds to Product Owner, Project Leader combines Scrum Master and Tech Lead responsibilities, and Collaborators correspond to the Development Team.
### What GoalPath changes
**Fixed weekly cadence instead of configurable sprint length.** Scrum teams spend real time debating whether to run one-week, two-week, or three-week sprints. GoalPath removes that decision. The week is the unit. Monday to Sunday, every week. Less ceremony, same rhythm.
**No sprint commitment ritual.** Scrum's sprint commitment is an agreement the team makes at the start of each sprint: these items, and no others, are in scope. GoalPath drops this in favor of continuous flow within the weekly cadence. Work is prioritized and pulled from the top of the backlog. There is no locked-in scope to protect or renegotiate mid-sprint.
**Automated velocity tracking and forecasting.** In Scrum, burndown charts and velocity reports are typically maintained by the Scrum Master or tracked in a separate tool. GoalPath calculates velocity automatically from completed work and runs Monte Carlo simulations to generate delivery forecasts. No manual tracking, no spreadsheets.
**Automated progress reports replace manual sprint reviews for stakeholders.** Scrum's sprint review is a ceremony where the team demonstrates completed work to stakeholders. GoalPath generates a structured progress report weekly, covering what shipped, what is in progress, what is blocked, and how forecasts changed. Stakeholders get the information without requiring a scheduled meeting.
**Meeting facilitation built into the tool.** Alignment meetings and standups run through structured stages with built-in timers. The agenda is in the interface, not in a Confluence page someone has to remember to follow.
**Business value voting replaces unilateral Product Owner prioritization.** Scrum concentrates backlog prioritization with the Product Owner. GoalPath distributes voting across frameworks (RICE, MoSCoW, Impact and Effort, Weighted Scoring) and normalizes results to a 1-100 score. The team provides input, the data informs the decision, and the owner or project leader makes the final call with better information than a single person's judgment alone.
## GoalPath and Kanban
Kanban's influence on GoalPath shows up in the flow-based thinking underneath the weekly cadence.
### What GoalPath borrows from Kanban
- A visual board for tracking work across states
- Flow-based thinking: reduce work in progress, optimize throughput
- Pull-based assignment: teams pull work from the top of the backlog rather than having it assigned top-down
- WIP monitoring to surface bottlenecks and stuck items
### What GoalPath changes
**Adds a time-boxed cadence.** Pure Kanban is continuous flow with no fixed time boundaries. GoalPath adds a weekly rhythm for reporting, velocity calculation, and alignment ceremonies. Teams get flow-based thinking without losing the predictability that comes from a shared cadence.
**Adds estimation.** Kanban often skips story point estimation in favor of cycle time tracking. GoalPath uses story points because they enable Monte Carlo forecasting. The trade-off is the effort of estimating. The benefit is a forecast teams can plan against.
**Adds structured ceremonies.** Kanban relies on ad-hoc continuous improvement (kaizen). GoalPath structures this into weekly retrospectives and alignment meetings. The structure is lighter than Scrum's ceremonies, but more explicit than Kanban's informal approach.
## GoalPath and SAFe
SAFe (Scaled Agile Framework) is designed for large organizations: multiple teams, portfolio-level planning, program increments, and the coordination overhead that comes with scale.
GoalPath is designed for teams of five to twenty people.
If your organization is running SAFe, GoalPath is not the right tool. If SAFe feels like a 50-person framework being applied to a 10-person team, GoalPath might be what you need.
The comparison is less about which is better and more about fit. SAFe solves real coordination problems at scale. Those problems do not exist at the team sizes GoalPath targets, and applying SAFe to small teams creates overhead without benefit.
## Framework Comparison Table
| Aspect | Scrum | Kanban | SAFe | GoalPath |
|---|---|---|---|---|
| Cadence | Configurable sprint (1-4 weeks) | Continuous flow | Program increment (8-12 weeks) | Fixed weekly |
| Roles | Product Owner, Scrum Master, Dev Team | No prescribed roles | Product Management, RTE, Agile Team | Owner, Project Leader, Collaborator, Stakeholder |
| Ceremonies | Sprint planning, daily standup, review, retrospective | Ad-hoc reviews, kaizen events | PI planning, system demo, inspect and adapt | Alignment meeting, standup, milestone planning, roadmap planning, retrospective |
| Estimation | Story points or hours | Often skipped | Story points | Story points |
| Forecasting | Manual burndown, velocity charts | Cycle time, throughput | Program-level burnup | Automated Monte Carlo simulation |
| WIP management | Sprint scope as implicit WIP limit | Explicit WIP limits | Capacity allocation | Monitored, not enforced |
| Team size | 3-9 | Any | 50+ | 5-20 |
| Facilitation | Scrum Master runs ceremonies | Team-driven | Release Train Engineer | Built into the tool |
| Prioritization | Product Owner decides | Replenishment meetings | Portfolio Kanban, WSJF | Business value voting |
| Reporting | Manual sprint review | Flow metrics | PI milestones | Automated weekly reports |
## Who Benefits Most from GoalPath
GoalPath works best for teams that already understand Scrum or Kanban concepts but are finding the operational overhead does not scale with their size.
The most common profile: a team of six to fifteen people where the technical lead is also the de facto process owner. They know what a retrospective is for. They know why WIP limits matter. They have run standups before. What they do not want is to spend four hours a week on process administration: updating the board, calculating velocity, preparing the sprint review, writing the status report, scheduling all the meetings.
GoalPath handles the administration. The team brings the judgment.
Teams that fit this profile:
- Product teams without a dedicated scrum master
- Engineering teams where the lead is also building
- Teams that have tried Scrum and found it too heavy
- Teams using Kanban but wanting more structure around planning and forecasting
- Remote teams that need a consistent async process
Teams that probably need something else:
- Organizations with multiple teams needing cross-team coordination (look at SAFe or LeSS)
- Teams with strict compliance requirements needing full process audit trails
- Very small teams of two to three people (the overhead of any structured process is probably too much)
- Teams where the process problem is actually a team dynamics problem that tooling cannot solve
---
See also: [Process Framework overview](/docs/process) for the full picture of how GoalPath's process fits together, and [Automation and Principles](/docs/process/automation-and-principles) for detail on what GoalPath handles automatically versus what stays with the team.
---
#### The Process with an AI Coding Assistant
# The Process with an AI Coding Assistant
The GoalPath process has four phases: Discovery, Planning, Execution, and Delivery. Normally, a human navigates each handoff. With the GoalPath skills plugin for Claude Code installed, your AI coding assistant can drive those handoffs for you.
This is not "AI writes your code." It is "AI operates the process." Your team still decides scope. You still approve the plan. You still review the PR. What changes is the mechanical work between those decisions: researching ideas, breaking them into items, working through a backlog, and posting progress to the board.
The result, for a well-scoped milestone, is that you can go from rough idea to a PR with 80% of the feature built, overnight.
## What Changes
Without AI skills, the handoffs between process phases require human initiative:
- Someone has to write the PRD
- Someone has to run the planning meeting and create the items
- Someone has to pick up items, set statuses, and post updates
- Someone has to run code review before the PR
With the skills plugin, your AI coding assistant takes responsibility for the mechanical parts of each of these. You provide decisions at key review points. The assistant handles the execution between them.
GoalPath is a good substrate for this because its data is structured: items, milestones, statuses, highlights, and comments are all readable and writable via the MCP server. The assistant can set an item to Started, check off subtasks as work progresses, flag a Question highlight when it needs a decision, and post a completion comment, all without leaving the terminal. Stakeholders watching in GoalPath see real progress, not a batch update at the end.
## The Five Skills
The skills plugin installs five slash commands that map onto GoalPath's process phases.
### `/goalpath-discover`: Idea to PRD
**When to run**: You have a rough idea, an empty milestone, or a half-formed thought that needs shaping before anyone starts planning.
**What it takes as input**: A phrase, a GoalPath milestone URL, or plain text describing what you want to build.
**What it does**: The assistant acts as a product sparring partner, not a yes-machine. Before drafting anything, it probes the problem with focused questions: Who specifically benefits from this? What is the single thing that will be true when it ships? What are you explicitly not building? It also does two parallel research tasks that are mandatory, not optional: web research to understand what competitors do and what the known pitfalls are, and a codebase exploration to understand what already exists and what is architecturally feasible.
After that research, it drafts a PRD in structured markdown covering purpose, primary outcome, success metrics, design principles, core scope, non-goals, and open questions. It then iterates with you, typically one to three rounds, until the PRD is sharp enough that someone could reasonably disagree with it. A PRD that nobody can argue with is too vague to build from.
**What you review**: The PRD content. You can push back on scope, cut sections, or redirect the approach. The assistant revises until you are satisfied.
**What it produces**: A GoalPath milestone with the PRD saved to its description and the status set to Planning.
**Handoff**: After saving, the assistant suggests running `/goalpath-plan` on the milestone URL.
### `/goalpath-plan`: PRD to Work Items
**When to run**: A milestone has a PRD or a clear enough description to break into concrete items.
**What it takes as input**: A GoalPath milestone URL or UUID.
**What it does**: The assistant fetches the milestone, reads the PRD, and launches up to three parallel codebase explorations to understand what already exists in the relevant areas: data models, API endpoints, UI components, and routes. Based on that, it proposes a set of implementation items with titles, types (Feature, Task, Bug), estimates for Feature items on the Fibonacci scale, subtasks, and dependencies.
Items are ordered for implementation: backend before frontend, dependencies before what depends on them, riskiest work first. Estimates are calibrated for AI-assisted development, so a 3-point Feature means one to two hours of focused work, not a traditional full-day estimate. The planner actively resolves ambiguity during this phase by asking you directly, rather than deferring unclear questions as highlights on items. The goal is that every item created is ready to start immediately.
**What you review**: The proposed item list. You can request splits, combinations, reordering, deferral to Icebox, or clarification on any item. The assistant iterates until you approve.
**What it produces**: Items created in GoalPath with subtasks attached, and the milestone status updated to Planned.
**Handoff**: After creating items, the assistant suggests running `/goalpath-implement` on the milestone URL for a full sweep, or `/goalpath-work` on individual items.
### `/goalpath-implement`: Milestone to PR
**When to run**: A milestone has planned items and you want to implement all of them on a single branch with one PR. This is the long-running skill, designed to run overnight or unattended.
**What it takes as input**: A GoalPath milestone URL or UUID.
**What it does**: The assistant creates a feature branch, reads every item and its subtasks, and works through them in implementation order. For each item, it sets status to Started in GoalPath, delegates the actual coding to specialist subagents (data model, backend, frontend, test writing), checks off subtasks incrementally as each completes, commits with a descriptive message, posts a completion comment on the item, and sets status to Finished.
If it encounters a decision that needs human input, it sets a Question highlight on the item, documents its recommended default assumption, notes what it will do in the meantime, and continues. It does not block waiting for a response. You can answer asynchronously in GoalPath and the next run will pick it up.
After all items are complete, the assistant runs the build and test suite, fixes any failures, and then runs two rounds of code review before creating the PR. The first round checks spec compliance: does the implementation match the planned items? The second round checks code quality: naming, structure, duplication, and whether the fixes from round one introduced new issues.
**What you review**: The PR. Items are updated throughout, so you can also watch progress in GoalPath while the skill runs.
**What it produces**: One branch, one PR, one database migration if applicable. GoalPath items have completion comments, checked subtasks, and status set to Finished.
**Re-run behavior**: If you reject items after reviewing the PR, run the skill again on the same milestone. The assistant picks up from the current state: it leaves Accepted items alone and works through Rejected or NotStarted items. For a single-item rework, run `/goalpath-work` with the item URL directly instead. This is the human-in-the-loop mechanism: approve what is good, reject with a sentence of feedback, re-run.
### `/goalpath-work`: Single Item to Code
**When to run**: You want to implement one specific item, either as part of a milestone sweep or as a standalone piece of work.
**What it takes as input**: A GoalPath item URL or UUID.
**What it does**: The assistant fetches the item, its subtasks, and any existing comments. It sets status to Started, then launches an Explore agent to understand the relevant parts of the codebase before writing a line of code. Based on that exploration, it plans the approach and presents it for approval on non-trivial items before proceeding.
Implementation is delegated to the appropriate specialist agent for the domain. Subtasks are checked off as each completes, not batched at the end. After implementation, the assistant runs the build and test suite, fixes any failures, and runs two rounds of code review before marking the item Finished and posting a summary comment.
If the item was previously Rejected, the assistant reads the rejection comments to understand what was wrong, sets status back to Started, and addresses the issues. Rejected items are not failures, they are feedback with context.
**What you review**: The code changes. The item summary comment in GoalPath tells you what was implemented and what files were affected.
**What it produces**: Code committed on the current branch, item status set to Finished, subtasks all checked off, and a summary comment on the item.
### `/goalpath-status`: Quick Status Check
**When to run**: Any time you want a read on where things stand.
**What it does**: Lists your assigned items grouped by urgency. Items with Blocked, Question, or Discussion highlights appear first. Then items in progress, with subtask completion counts. Then items ready to start, in priority order. Then recently finished items.
**What it produces**: A summary line showing counts by status and a suggested next action. If something is blocked, it surfaces that first. If nothing is in progress, it points to the highest-priority NotStarted item.
## A Worked Example: Feature from Idea to PR
This is what "80% of a feature overnight" looks like in practice.
**Morning: Discovery (20 minutes)**
You have a rough idea: milestone progress reports that stakeholders can read without attending a meeting. You run:
```
/goalpath-skills:goalpath-discover "stakeholder progress reports for milestones"
```
The assistant asks a few focused questions. Who are the stakeholders, and what do they need to know? How often? What format would they actually read? You spend about 20 minutes in conversation. The assistant also checks your codebase for what report infrastructure already exists, and searches the web for how other tools handle this.
The session ends with a PRD saved to a new GoalPath milestone. It covers the primary outcome (stakeholders see milestone health without asking the team), the report structure, what is out of scope (no custom scheduling, no email templates in v1), and one open question about language preferences.
**Midday: Planning (15 minutes)**
You run:
```
/goalpath-skills:goalpath-plan https://goalpath.app/roadmaps/.../milestones/abc-123
```
The assistant proposes nine items: a data model task for report storage, a background job task for weekly generation, four feature items for the report UI, two feature items for the delivery mechanism, and one task for the email notification scheduling. Total: 18 points. You ask it to defer the language preference feature to a later milestone, which removes one item. You approve. Eight items are created in GoalPath.
**Evening: Implement (kicks off, runs overnight)**
You run:
```
/goalpath-skills:goalpath-implement https://goalpath.app/roadmaps/.../milestones/abc-123
```
The assistant creates a feature branch, works through the items in dependency order, and posts comments to GoalPath as each item completes. Partway through, it hits a question about how to handle milestones with no completed items yet: report them as "no data" or skip them entirely? It sets a Question highlight on the relevant item, documents that it will default to "no data" for now, and continues.
You see the highlight in GoalPath the next morning and answer in a comment. The assistant has already proceeded with a reasonable default.
**Next morning: Review**
The PR is open. Seven of eight items are done cleanly. One item has a Question highlight from the evening. You answer the Question in a comment, and the assistant's default turns out to be fine, so you accept that item. You review the rest of the PR, merge what looks good, and leave a rejection comment on one item where the report format does not match what you described in the PRD.
**Later: Rework**
You run `/goalpath-work` with the rejected item's URL. The assistant reads your rejection comment as direction, moves the item back to Started, reworks it, and marks it Finished. A new commit is pushed. The PR is updated. If more than one item had been rejected, you could run `/goalpath-implement` on the milestone instead: the assistant would leave the Accepted items alone and only work through what still needs changes.
## The Rejection Loop
The human-in-the-loop mechanism is built around item status and comments. Here is how it works:
1. The skill implements items and marks them Finished
2. You review the PR (or individual items in GoalPath)
3. For items that need rework, you reject them in GoalPath and add a comment explaining what was wrong
4. You re-run. Two options:
- Run `/goalpath-implement` on the milestone. The assistant picks up from the current state: it leaves Accepted items alone and works through Rejected and NotStarted items.
- Run `/goalpath-work` on a single Rejected item. This is useful when only one or two items need changes and you do not want the overhead of a full milestone pass.
5. The rejection comments become direction for the rework. The assistant moves the item back to Started, reworks it, and marks it Finished for another review.
This loop can repeat as many times as needed. Most features need one or two rework passes on a small subset of items. The key is that rejection comments become the brief for the next run: short, direct feedback is more useful than vague dissatisfaction.
## When Not to Use This
The skills work best when GoalPath has the context the agent needs. There are situations where they are not the right tool.
**Greenfield architecture decisions**: The discover skill will research and frame the problem well, but it cannot decide fundamental architectural choices for you. Those require human judgment informed by context the agent cannot fully see: team skills, organizational constraints, long-term technical strategy. Use discover to frame the decision clearly, then make it yourself before planning.
**Work spanning systems the agent cannot access**: If implementation requires making changes in an external system, coordinating with a third-party API the agent cannot call, or merging changes across multiple repositories, the implement skill cannot complete the loop on its own. It will flag blockers, but the resolution is manual.
**Milestones without structure**: The plan skill needs a PRD or clear description to work from. The implement skill needs planned items in priority order. If a milestone is a blank name with no description and no items, there is nothing for the skills to anchor to. Run discover first, then plan, before attempting implement.
**Teams not yet set up in GoalPath**: The skills read and write GoalPath data. If your team does not have a roadmap, milestones, or an agreed priority order, the skills have no substrate to work with. Get the process foundation in place first.
## What GoalPath Provides to Make This Work
The skills rely on GoalPath being a structured, writable representation of the process. Three things matter:
**Structured data the agent can read and write**: Items, milestones, statuses, highlights, subtasks, and comments are all first-class objects with a clean API. The MCP server exposes 38 tools covering the full lifecycle. The agent is not screen-scraping or guessing at state: it is reading and writing the same data your team sees in the UI.
**Rejection comments as direction**: When you reject an item and write a comment, that comment becomes the brief for the next implement run. GoalPath treats rejection comments as first-class inputs, not just audit trail. This is what makes the feedback loop work.
**Highlights for async decisions**: The Question and Blocked highlights are designed for situations where the agent needs human input but should not block. The agent flags the question, documents its default assumption, continues working, and the human answers in GoalPath when they have a moment. The next interaction, whether a status check or another implement run, picks up the response. This is how the process stays asynchronous without losing human oversight.
---
For more on the process phases these skills map onto, see the [Process Framework overview](/docs/process). For the planning meeting that `/goalpath-plan` automates, see [Milestone Planning](/docs/process/ceremonies/milestone-planning). For the principles behind what GoalPath automates versus what stays with humans, see [Automation and Principles](/docs/process/automation-and-principles). For installation and command reference, see [AI Skills](/docs/integrations/ai-skills).
---
## Blog
### What's New in August
*Published: 2026-09-06*
## New
**Report a bug or idea without leaving the page.** A "Report a bug or idea" button now lives in the footer of every page. Add a note, and attach a screenshot of the page with one click if it helps explain what happened. No more describing a broken layout in words alone.
**Promote a subtask to its own item, or an item to its own milestone.** When something you scoped as small turns out to need its own tracking and forecast, promote it up a level. Look for this icon in the item card's action row, between share and edit, and click it: . No recreating it from scratch, no losing its history.

**Mermaid charts render in docs and blog posts.** Pie, bar, and line charts written in standard Mermaid syntax now render inline, next to the flowcharts and sequence diagrams that already worked.
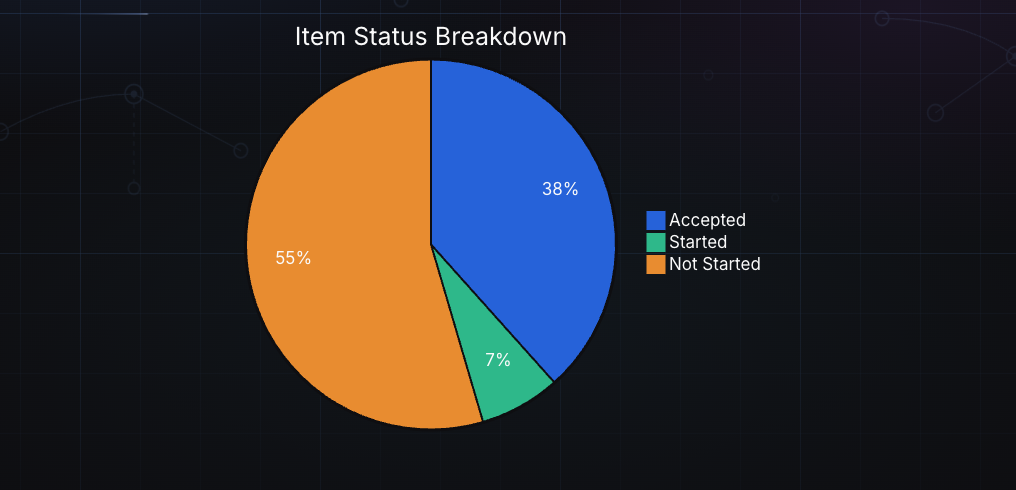
**AI agents connected over MCP can now see an item's history, not just its current state.** A new `list_item_activity` tool returns who did what and when: status changes, assignments, moves, the decision text behind a resolved highlight, and any commits or pull requests linked to the item if your repository is connected. Before this, an agent picking up an item had no way to know a decision had already been made days earlier.
## Improved
**The milestone picker remembers your last choice and lets you create one inline.** Moving an item to a milestone no longer means abandoning the form to go create one first. Pick "New milestone" right there, or let the picker default to whichever one you used last.
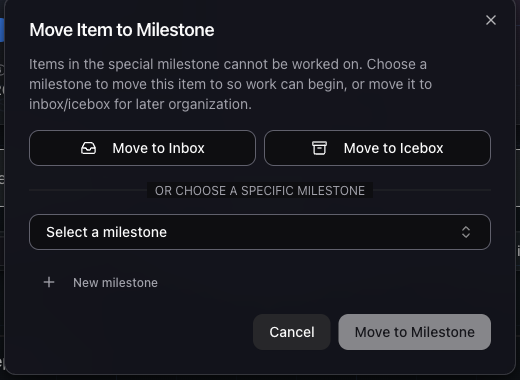
**Probability-line tooltips now show confidence percentiles, not just a date.** Hovering a forecast marker tells you how likely that date is, not only what it is.
**Planning a milestone is now limited to Owners and Project Leaders.** Collaborators still add items, comment, and move work forward, but setting a milestone's plan and locking its scope is a leadership action.
## Fixed
- Item cards collapse automatically the moment you start dragging one.
- Search resolves `#GP-47` shortcuts directly, instead of requiring a full-text match.
- Watchers get an email the moment an item is marked Delivered, not only once it's Accepted.
- Standup shows a "Finish Milestone" button the moment there's nothing left to work on, instead of an empty screen.
- The watching page tells requesters apart by avatar, and adds a "Created by me" filter.
- Accepted items on the watching page collapse behind a toggle instead of staying in the main list.
- The CLI's MCP setup now supports Codex, not just Claude.
- Reinvited members no longer stay stuck disabled after accepting, and the last remaining Owner on a project can no longer be disabled or removed by mistake.
- The watching page's item list updates the moment you change an item from that page, instead of waiting for a refresh.
- Finishing a milestone's last item now shows the right "all done" view immediately, not after a reload.
- Trial projects can change seat count again, and the team filter dropdown no longer renders underneath the list.
- The onboarding wizard can be skipped.
- Browser extension links go straight to each store's listing instead of a generic page.
- A rare client-side crash from a malformed realtime update is gone, and the bug report dialog no longer looks frozen while it's capturing a screenshot.
- A crash or auth error now shows a proper page with a way to report it, instead of a blank screen.
- Clicking a milestone in the voting list now opens its detail drawer, instead of doing nothing.
- Sending an invite now validates the email and shows it as pending right away, instead of only after a refresh.
- Inbox and Icebox milestone cards are now equal height.
- Blocked/Question/Discussion item cards and Deadline items were nearly unreadable in dark mode. Both now use colors that meet contrast requirements.
- Inviting someone who's already an active member no longer creates an invite that can never be resolved. We also cleaned up an existing stuck invite this caused.
- The MCP server's OAuth discovery documents could come back with a stray newline in every URL, which broke stricter OAuth clients even though logins from GoalPath's own apps kept working.
For the full list, check the activity feed on any project you're a member of.
---
### Your task list, right where you code
*Published: 2026-06-18*
## The tab you keep forgetting to check
If you have worked with any project management tool, you know the pattern. You open the board in the morning, scan your items, close the tab, start coding. Three hours later someone asks "did you start that item?" and you realize you forgot to move it.
The board is in one window. Your code is in another. And the gap between them is where status updates go to die.
This is not a discipline problem. It's a proximity problem. The further your task list is from where you actually do the work, the less likely you are to keep it updated. And when items don't get updated, the forecasts drift, the progress reports are stale, and your team lead starts asking in Slack instead of checking the board.
## So we put it in the sidebar
The GoalPath VS Code extension adds your assigned items directly to the editor sidebar. Not a webview, not an embedded browser. A native VS Code tree view that loads fast and stays in sync.
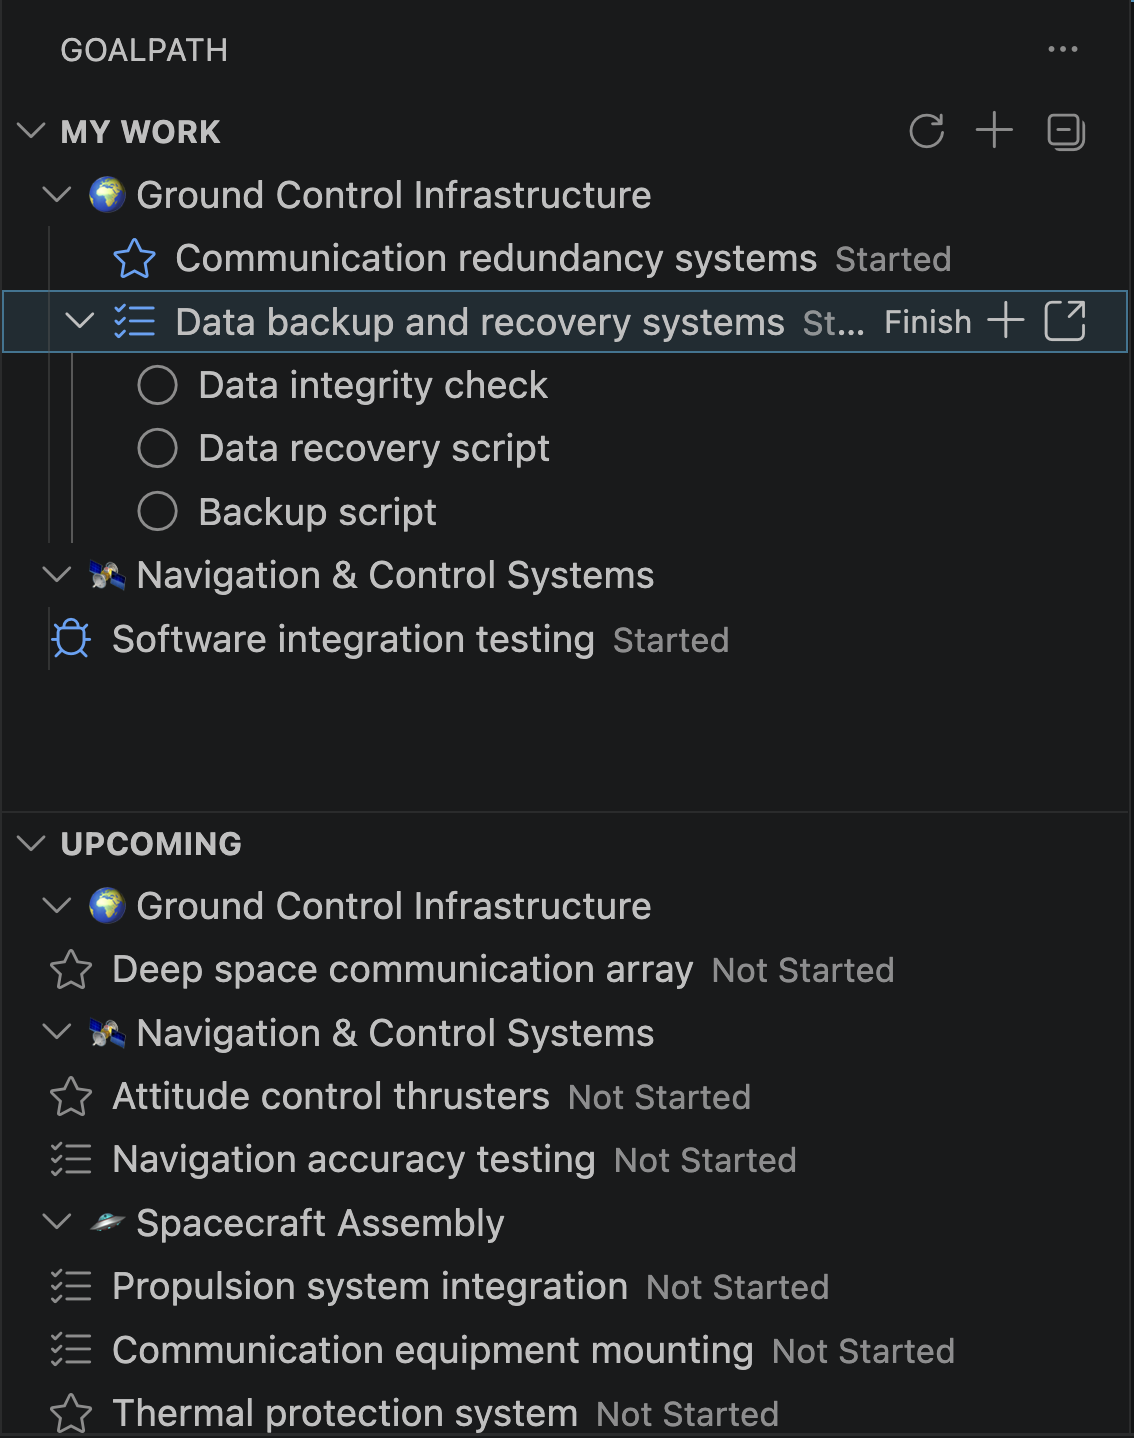
Two sections. **My Work** shows what's assigned to you, grouped by milestone. **Upcoming** shows what's available to pick up next from your active milestones.
Each item shows its current status. Items with subtasks expand to show them as checkboxes. Click to toggle, and the progress updates for your whole team in real time.
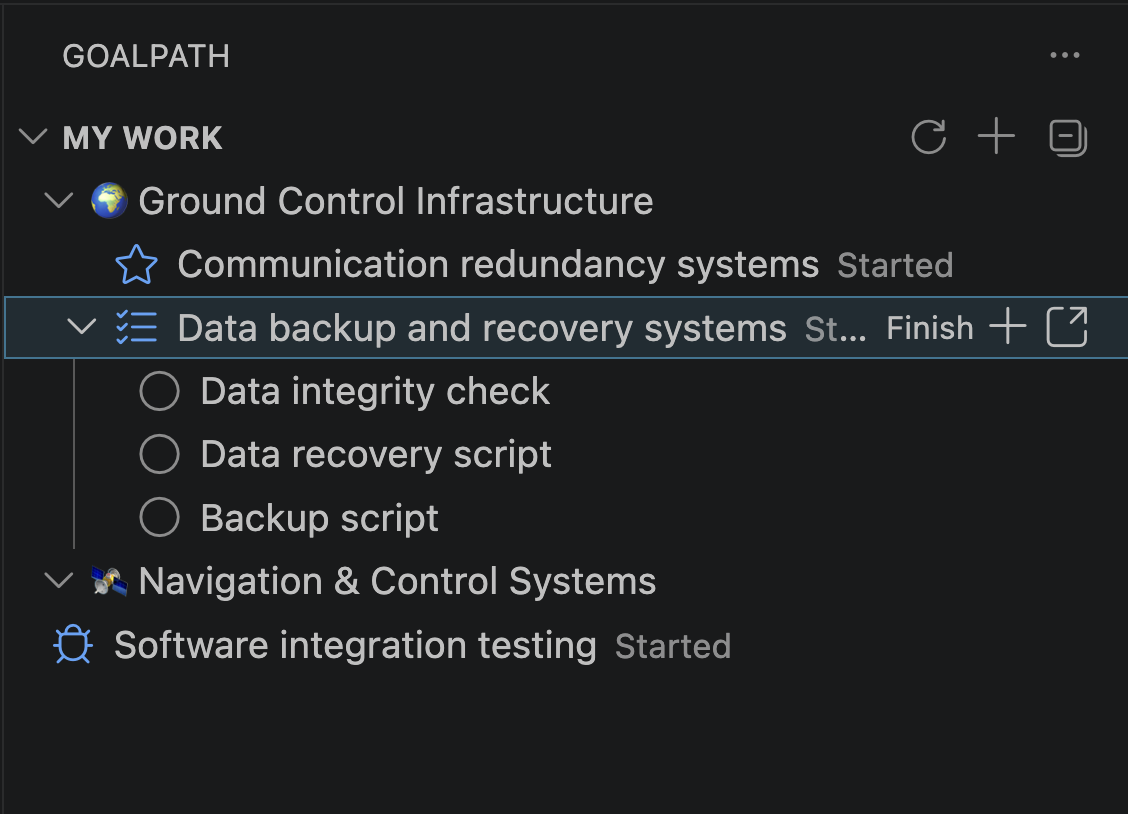
## One click to progress
Hover an item and you see the next action. "Start" when you pick it up. "Finish" when the code is done. "Deliver" when it's ready for review.
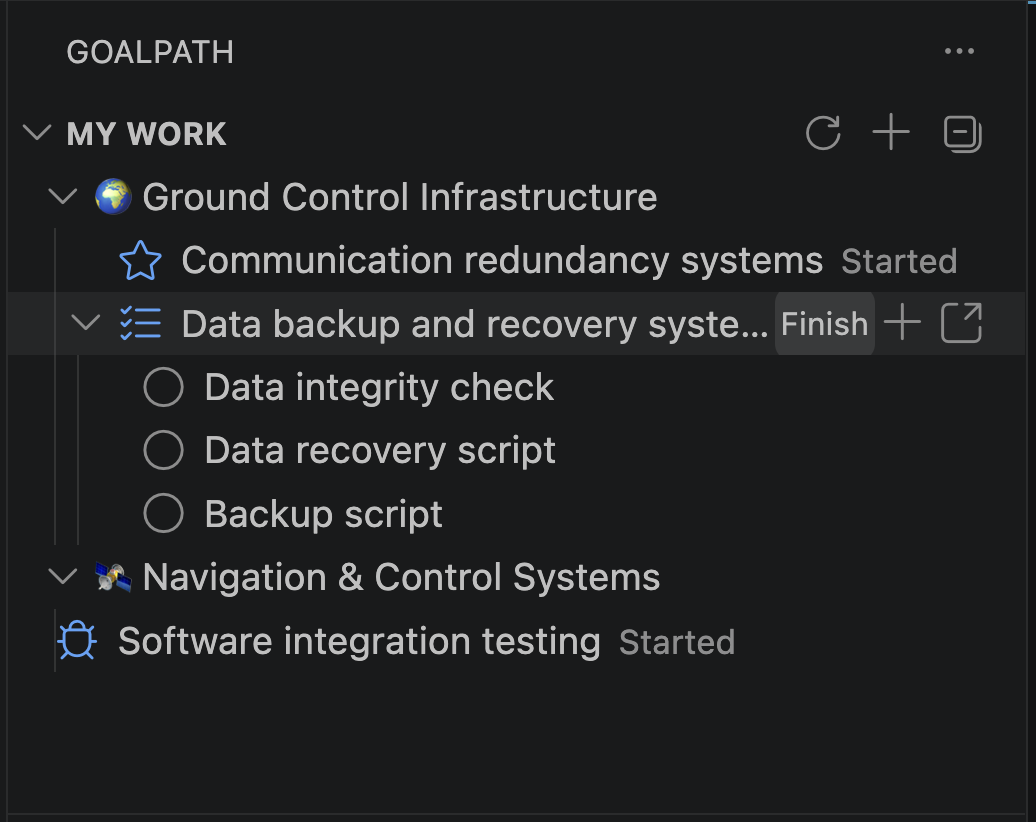
This is where it makes a difference for your team. Because when status updates happen at the moment the work happens, the data in GoalPath is always fresh. Forecasts stay accurate. Progress reports reflect reality. Nobody needs to ask "where are we?" because the answer is already there.
For delivered items, you get Accept and Reject buttons instead. Rejecting prompts for a reason, which gets posted as a comment so the developer has context without a separate conversation.
## Blockers get reported when they happen
Right-click any item to flag it as Blocked, Question, or Discussion. Type a quick explanation. Your team lead sees it in GoalPath immediately.
This matters because of timing. If flagging a blocker means opening a browser, finding the item, and writing a comment, most developers just keep pushing and mention it at the next standup. By then half a day is gone. When flagging is two clicks away in your editor, blockers surface hours earlier.
## Everything from the keyboard
The command palette (Cmd+Shift+P) has all the GoalPath commands. Sign in, switch projects, add items, refresh. No mouse required.
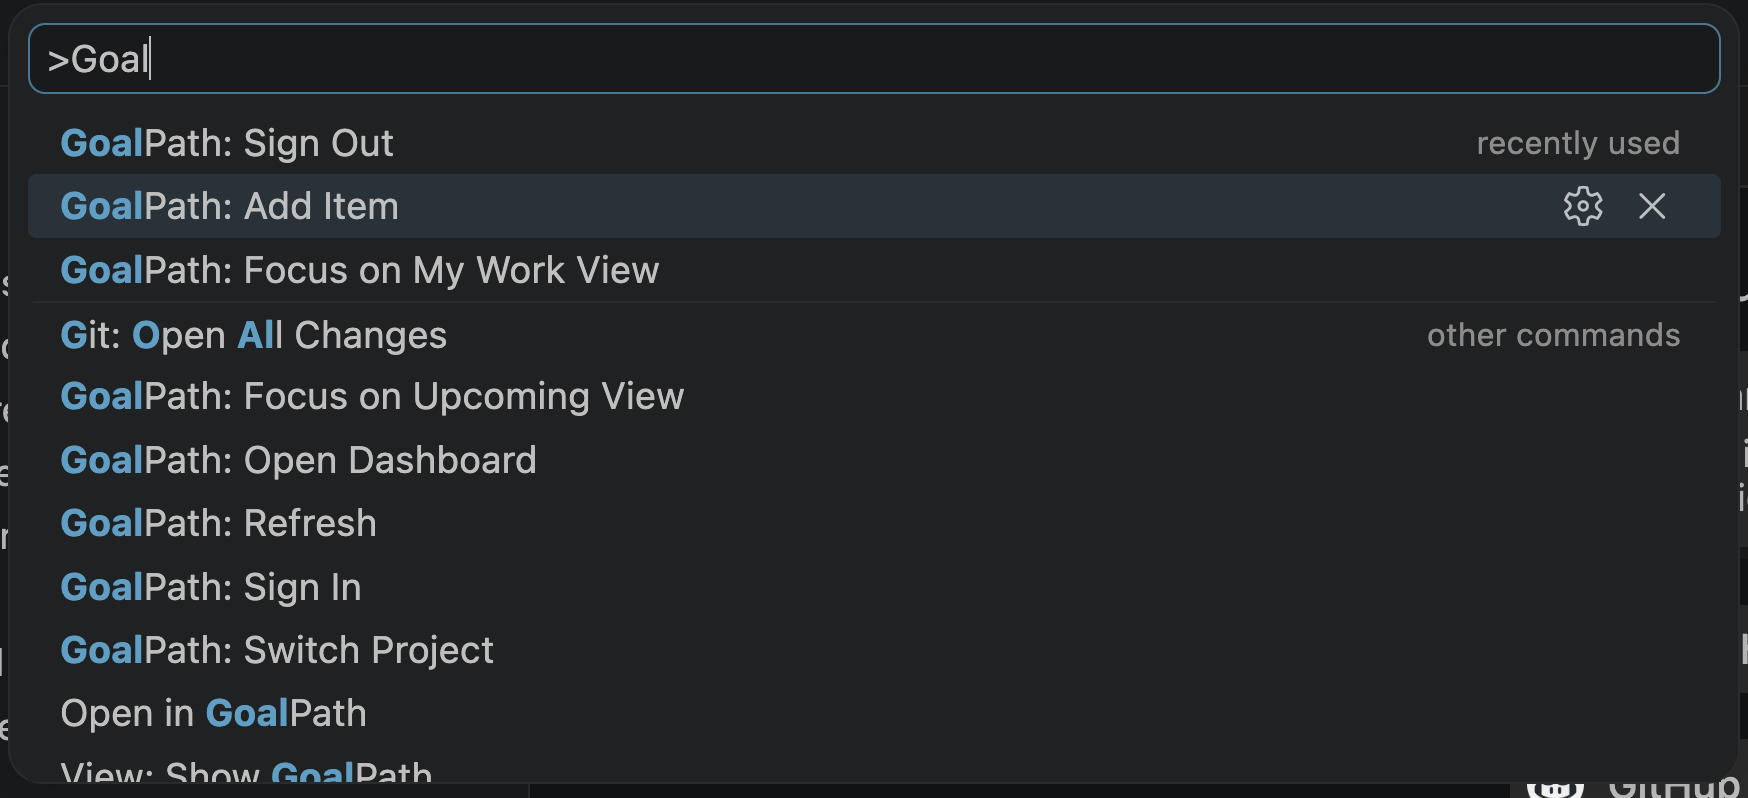
Adding a new item works the same way. Pick the type, write a title, choose a milestone or send it to the inbox. Done in three steps without leaving your editor.
## Setup takes 30 seconds
Install from the [VS Code Marketplace](https://marketplace.visualstudio.com/items?itemName=GoalPath.goalpath). Click the GoalPath icon in the Activity Bar. Paste your API key (you can [generate one in your profile](https://goalpath.app/profile/api-keys)). Pick your project.
If your repo already has a `.goalpath` file from the GoalPath CLI or MCP server, the project is selected automatically. Commit that file once and every developer on the team gets the same sidebar with zero configuration.
## GoalPath goes where the developer is
This is the third integration we've built that meets developers in their existing tools. The [Chrome extension](/features/chrome-extension) captures bugs from the browser. The [MCP server](/features/ai-coding-assistant) connects AI coding assistants to your backlog. And now the VS Code extension puts your task list in the sidebar.
The pattern is the same in all three: reduce the distance between doing the work and recording the work. When that distance is zero, the data stays fresh. When the data stays fresh, the forecasts are accurate. When the forecasts are accurate, stakeholders stop asking "where are we?" and start making decisions from the dashboard instead.
That is what we mean when we say the process is embedded in the tools you already use.
[Install the VS Code extension](https://marketplace.visualstudio.com/items?itemName=GoalPath.goalpath). Free with any GoalPath plan.
---
### Cumulative flow and statistical process control for delivery
*Published: 2026-06-11*
## The chart nobody reads until something goes wrong
If you have worked on a software team that takes delivery seriously, you have probably seen a cumulative flow diagram in a presentation at some point. A colorful stacked area chart, different bands for each state on the board, growing to the right as time passes. Someone pulls it out during a retrospective, points to where a band gets thick, and says "see, this is where we had a bottleneck in March."
That is a useful post-mortem. It is less useful when the band is widening right now and nobody notices until a milestone is already late.
The promise of CFDs and statistical process control is genuine: they can tell you whether your delivery process is stable, whether the variance you see is just noise, and whether a slowdown is a real signal worth acting on. The problem is that most teams do not have the time or tooling to build and maintain these charts continuously. They get generated once a quarter, analyzed by one person who read a Kanban book, and then forgotten.
GoalPath includes a cumulative flow diagram on the velocity analytics page with four bands (Not Started, Started, Finished, Accepted) over time, with daily or weekly granularity and milestone filtering. But the chart is only one layer. GoalPath also surfaces the same underlying data as structured diagnostics: WIP levels, flow time trends, aging work, and velocity variance. The chart shows you the shape. The diagnostics tell you what to do about it.
## What a CFD is actually telling you
A cumulative flow diagram plots the number of work items in each state over time. The bands stack on top of each other. The bottom band is typically done items, growing steadily upward if work is actually finishing. The middle bands are your in-progress states. The top band is your backlog.
Three things are visible at a glance when a CFD is healthy:
**Band width** tells you work-in-progress at each stage. If the "In Review" band is thin and consistent, reviews are flowing. If it keeps getting thicker, work is queuing at review faster than it is being cleared.
**Band slope** tells you throughput. The slope of the topmost line of your "Done" band is your delivery rate. Steep slope means work is shipping. Flat line means it stopped.
**Vertical distance between lines** tells you cycle time. The gap between when work enters a state and when it exits is visible as vertical height on the chart. If that gap grows, items are spending longer in each stage.
The patterns you are looking for are divergence (bands widening unpredictably), stagnation (the done line going flat), and compression (bands narrowing, meaning one stage is starved of input). All three have different causes and different fixes.
## The signal-vs-noise question
Statistical process control, which is the manufacturing discipline this analysis comes from, was developed by Walter Shewhart at Bell Labs in the 1920s. His insight was simple: some variation in a process is just noise, random fluctuation that you should not act on. Other variation is signal, something in the system actually changed, and you should find out what.
The way you tell them apart is control limits. You calculate the average of your process metric and the standard deviation. Anything within roughly three standard deviations of average is probably noise. Anything outside those limits is worth investigating.
For software delivery, the equivalent question is: when your velocity drops one week, is that a real signal to be concerned about? Or is it just normal fluctuation in a complex system?
Most teams never answer this rigorously. They see a slow week and either panic and add meetings, or dismiss it and miss a real problem developing. The answer depends on how much variance is normal for your team, which requires measuring variance over time, not just looking at last week.
## Where teams actually get stuck
The practical failure mode is not that teams lack CFDs. It is that the data they need to diagnose problems lives spread across different places: the board shows current WIP, a spreadsheet tracks velocity, someone's notes have the context for why February was slow.
The "where are we?" sync exists precisely because this information is not connected in one place. You need a meeting to assemble the picture that the data already contains.
The ritual it spawns: a weekly or bi-weekly delivery review where someone manually aggregates the board state, eyeballs recent velocity, notes which items have been sitting a long time, and reports to leadership. This takes an hour of preparation and thirty minutes of meeting time. And it is still usually imprecise.
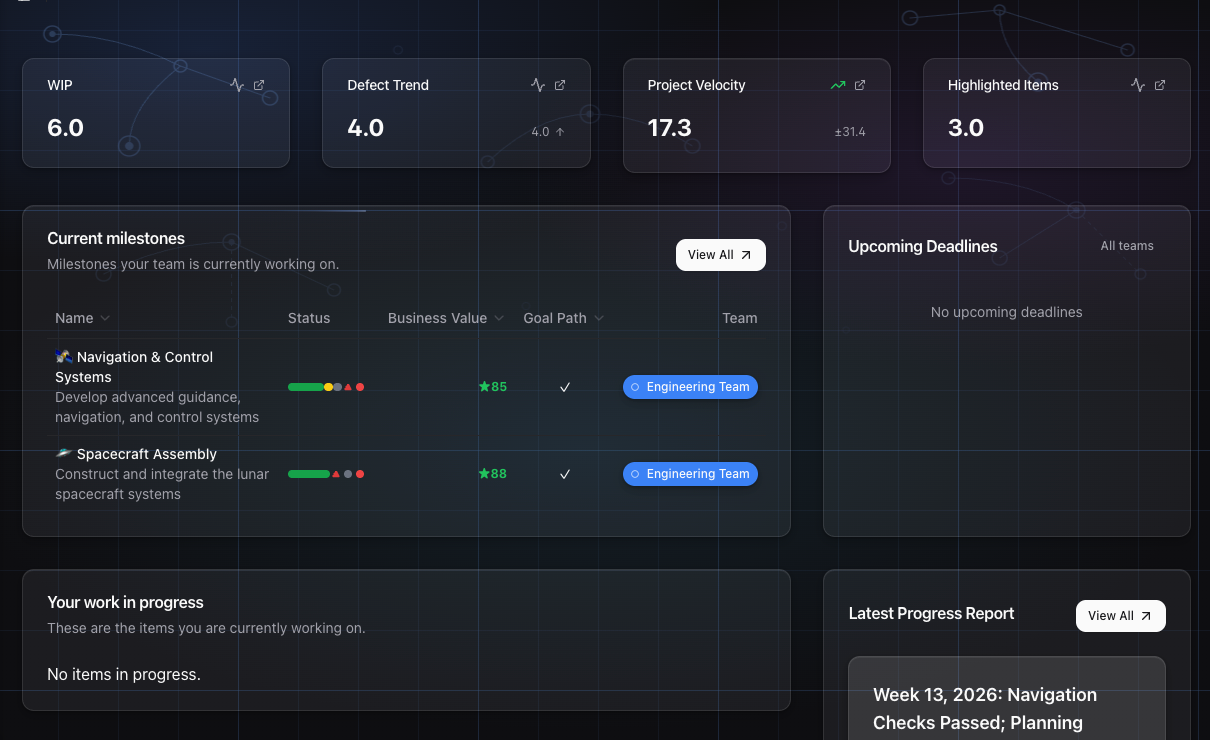
## How GoalPath approaches this
GoalPath gives you the CFD itself, and then goes further. The chart is there when you want the visual. The diagnostics below surface the same signals without requiring you to interpret bands on a graph.
**Flow load aging** shows you which items in progress have been there the longest. In a CFD, an aging item shows up as a band that stays wide. In GoalPath, it shows up as an item flagged by how many days since it was started. You do not need to spot the pattern in a chart. The aging is surfaced directly against each item. Items that have been sitting too long are visible in the flow load view without building anything.
**Flow time trends** track how long items are taking from start to finish over recent weeks. This is the equivalent of watching your cycle time on a CFD. If the trend is climbing, something in the process has changed. If it is stable, your process is in control in the SPC sense: it is predictable, even if not fast.
**Velocity variance and standard deviation** are how GoalPath models forecast uncertainty. Rather than giving you a single-point estimate for when a milestone will finish, GoalPath uses the actual variance in your team's velocity to widen or tighten the forecast range. High variance equals wider range. Consistent delivery equals tighter range. This is statistical process control applied directly to your forecasts. The team with a standard deviation of two points per week gets a tighter date range than the team with a standard deviation of eight, because their process is more in control.
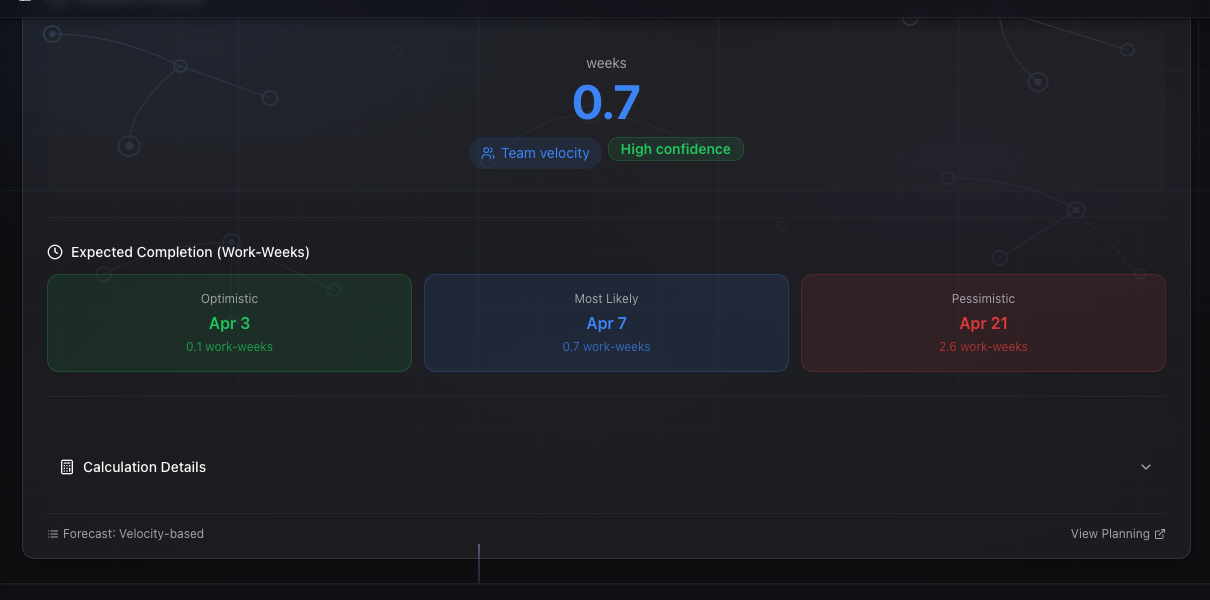
The insight categories these map to in GoalPath Insights are "Predictability & Forecasting" and "Flow & WIP", which is not a coincidence. Those are the same two questions a CFD answers.
## When variance is signal vs noise in practice
Here is the practical heuristic. If your velocity drops one week and then recovers without any change in the process, that is probably noise. If it drops and stays low, or drops in a way that correlates with a change you can name (a new engineer joined, a large unestimated item landed, a dependency got blocked), that is signal.
GoalPath's forecast range already accounts for your historical variance. If a slowdown stays within the range that the standard deviation predicts, you probably do not need to react. If your current pace is pushing the expected delivery date out beyond the pessimistic scenario, something real has changed and you need to find it.
The meeting that this replaces is the delivery review where someone says "we had a slow week, should we be worried?" GoalPath answers that question with data: here is how this week compares to your normal variance. Is this week outside your control limits? The mechanism is the structured execution data GoalPath collects as teams do their work, used to generate a forecast range grounded in how this team actually delivers, not a generic assumption.
## What to check if your flow looks unstable
If you are seeing high variance in GoalPath's forecasts, or if the flow load aging shows multiple items sitting in the same state for a long time, the diagnosis usually points to one of three places:
**WIP is too high.** Items enter faster than they exit. The CFD equivalent is bands widening. In GoalPath, this shows up as a long aging list with items across multiple milestones. The fix is to stop starting and start finishing.
**A stage is blocked.** One particular state accumulates items while others flow normally. In a CFD this is a specific band that widens while others stay thin. In GoalPath you can see this in the breakdown of where aged items are sitting. If they are all queued at the same point, that is your bottleneck.
**Estimation variance is high.** Items marked as "small" take wildly different amounts of time to finish. This inflates velocity variance without telling you anything useful about the process. The fix is not to estimate more precisely. It is to make items more consistently sized.
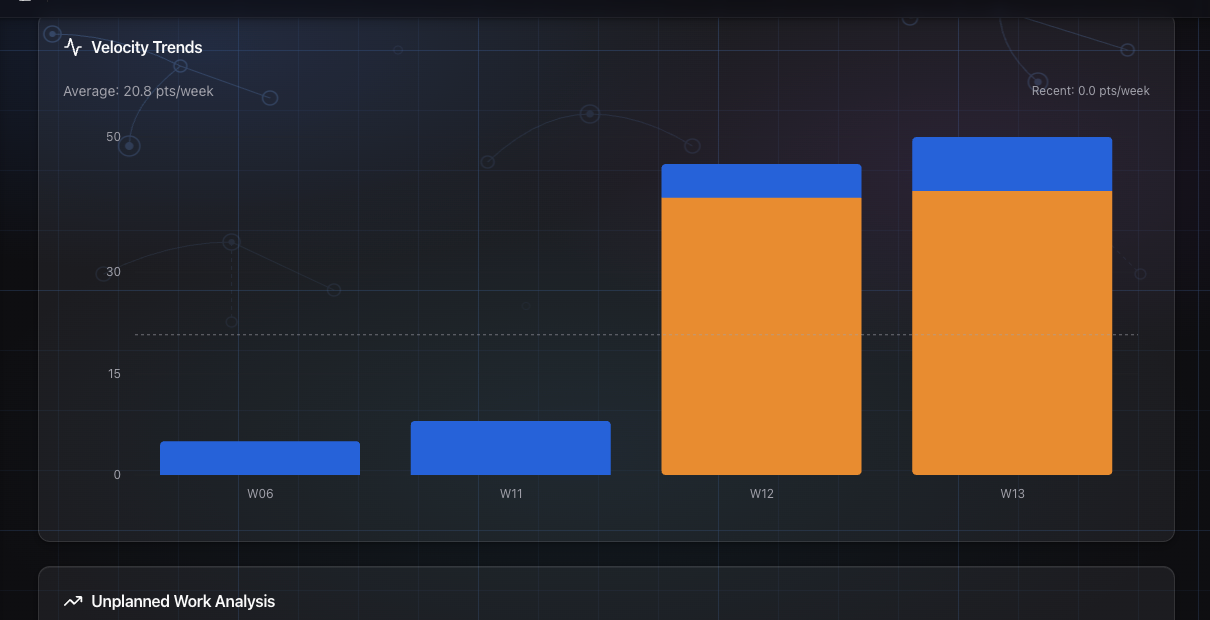
## The honest answer about CFDs
Teams that use CFDs religiously are doing something valuable. Having a visual representation of flow over time makes patterns visible that raw numbers hide.
GoalPath now gives you that visual: a stacked area chart on the velocity analytics page showing item counts per status over time. You can toggle between weekly and daily granularity, filter by milestone, and see exactly where bands widen or the done line goes flat.
But the chart alone is not the point. The questions a CFD answers (is my WIP growing, is my cycle time stable, am I delivering at a consistent rate) are also answered by the flow metrics, forecast variance, and aging views built into GoalPath. You get the chart when you want the pattern. You get the diagnostics when you want the action.
For most teams, the bottleneck was never the absence of a CFD. It was that the relevant data did not surface in the normal workflow until someone had already called a meeting about it. GoalPath puts it in the workflow (the chart, the metrics, and the coaching) so you see it before the meeting gets called.
---
**Further reading**
- [What Is the Cumulative Flow Diagram? (Businessmap)](https://businessmap.io/kanban-resources/kanban-analytics/cumulative-flow-diagram): a solid primer on reading CFDs, including the bottleneck and stagnation patterns
- [Aging Work in Kanban (Nave)](https://getnave.com/blog/aging-work-in-kanban/): how work item age connects to cycle time and forecast accuracy
- [SPC for DevOps (Airacad)](https://airacad.com/statistical-process-control-spc-for-devops-sre-metrics/): applying statistical control charts to software delivery metrics
- [4 Key Flow Metrics (Scrum.org)](https://www.scrum.org/resources/blog/4-key-flow-metrics-and-how-use-them-scrums-events): the canonical flow metrics framework: WIP, cycle time, throughput, and work item age
---
### The SPACE Framework: Beyond Throughput
*Published: 2026-06-04*
## Throughput is not the whole story
Most teams, when asked how productive they are, point to velocity. Points per sprint. PRs merged per week. Story points delivered against the roadmap.
It is not a bad instinct. Those numbers are real. But if you have ever managed a team that was hitting velocity targets and still missing every forecast, or watched a team slow down right before they burned out, you know that throughput alone is a bad summary of what is happening.
In 2021, a group of researchers from Microsoft, GitHub, and the University of Victoria published a paper in [ACM Queue](https://queue.acm.org/detail.cfm?id=3454124) called "The SPACE of Developer Productivity." Their core finding was simple: productivity cannot be reduced to a single dimension. They proposed five.
SPACE stands for Satisfaction, Performance, Activity, Collaboration and culture, and Efficiency. No single metric covers more than one of those dimensions. Which means if you are only tracking one thing, you are flying with four instruments missing.
## The five dimensions, in plain terms
**Satisfaction** is whether developers find the work meaningful, whether they feel the tools and process support them, and whether the job is sustainable. It shows up as retention, engagement, and the quality of work people are willing to put in when things get hard.
**Performance** is outcomes, not outputs. Did the features shipped actually achieve what they were meant to achieve? For a delivery team, it shows up as velocity, forecast accuracy, and change failure rate.
**Activity** is the volume of work happening. Commits, PRs, items in progress, tasks completed. Activity is easy to measure and easy to misread. High activity alongside low performance usually means something is broken in the flow.
**Collaboration and culture** is how well information moves across the team, and whether the environment supports people doing their best work. Are blockers surfaced quickly? Do people know what others are working on? Is the team aligned on priorities? This one is almost impossible to measure with tooling alone.
**Efficiency** is how smoothly work moves from start to done. Cycle time, flow efficiency, the ratio of active work time to total lead time. A team with poor efficiency is one where work starts and then sits, waiting for review, waiting for a decision, waiting for a dependency to resolve.
The paper's recommendation is to measure across at least three dimensions to get a meaningful picture. One or two dimensions creates blind spots you will not see until they become expensive.
## Which three GoalPath covers automatically
GoalPath does not cover all five. It is worth being honest about that.
Satisfaction requires asking people. No amount of workflow data tells you whether someone feels burned out or undervalued. That needs a survey, a one-on-one, a manager who is paying attention.
Collaboration and culture, in the sense the SPACE framework means it, is also hard to instrument. You can proxy it, but the real signal comes from observing how the team actually coordinates, what gets missed, where misalignment shows up after the fact.
What GoalPath does cover, and covers without any extra work from the team, is Performance, Activity, and Efficiency.
### Performance: velocity and forecasts
Every time a team marks work finished in GoalPath, the system updates its velocity model. Velocity is calculated across the last six weeks. Consistency matters as much as speed. A team that delivers 10 points every week is more predictable than one that swings between 5 and 20, and GoalPath tracks that variance and uses it to widen or narrow the forecast range accordingly.
The forecast tells you the expected completion window for each milestone, updated continuously as work comes in or slips. This replaces the "where are we?" sync, the Friday status email, and the quarterly guess-and-spreadsheet exercise that most teams still run.

### Activity: WIP and flow load
GoalPath tracks how many items are in flight across the team at any point, and how that load is distributed across milestones. GoalPath calculates a penalty for each team member based on how many milestones they are personally juggling, not as a punishment, but because the research is clear that context switching reduces effective throughput. The [original SPACE paper](https://queue.acm.org/detail.cfm?id=3454124) notes that high activity can actually be a warning sign: more volume sometimes means brute-forcing through bad systems, not genuine capacity.
The WIP view in GoalPath makes this visible. You can see instantly whether the team is focused or scattered. Items sitting in "Started" without movement flag early, before they become a stakeholder conversation about why the milestone is late.
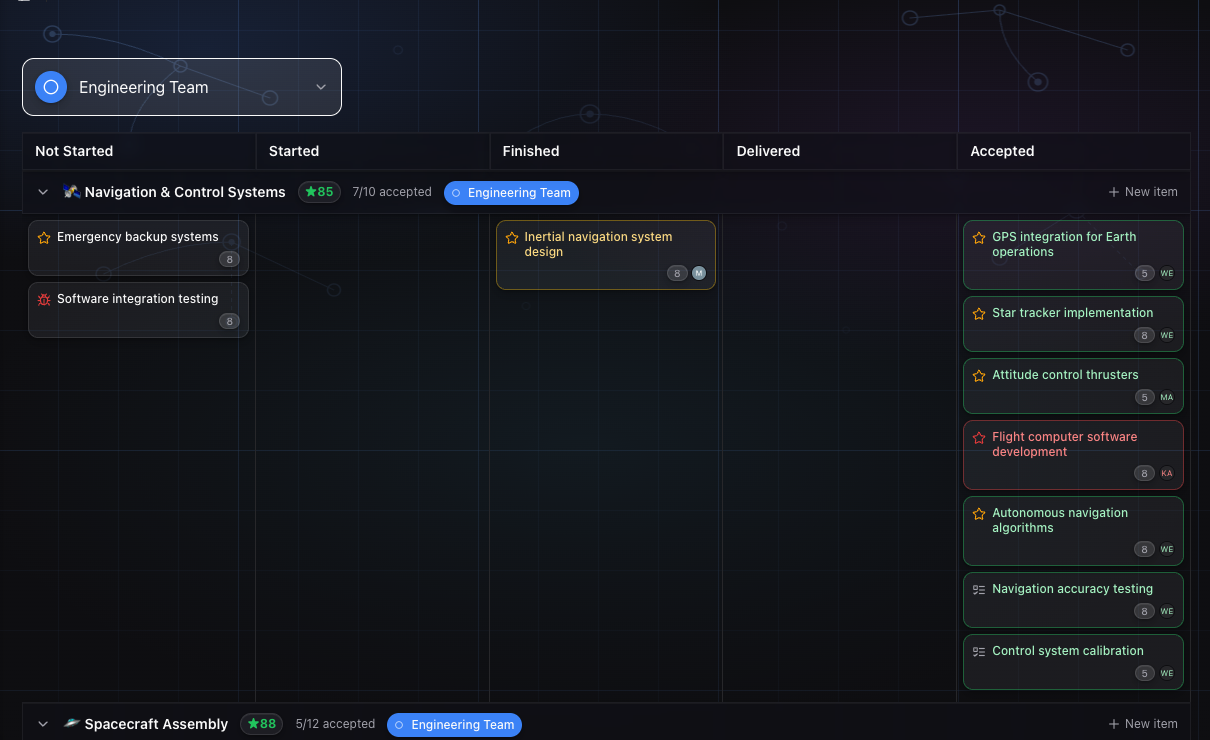
### Efficiency: flow efficiency and cycle time
Flow efficiency is the ratio of active work time to total lead time. Most teams sit at 15–25%, meaning three quarters of the time from "work started" to "work done" is waiting, not working. Reviews queued up, decisions pending, dependencies unresolved.
GoalPath tracks cycle time for every item, from when work starts to when it finishes, and surfaces items that are aging in place. This is where the efficiency dimension of SPACE becomes actionable. It is not that the team is slow. It is that something is blocking flow, and the data shows you where.
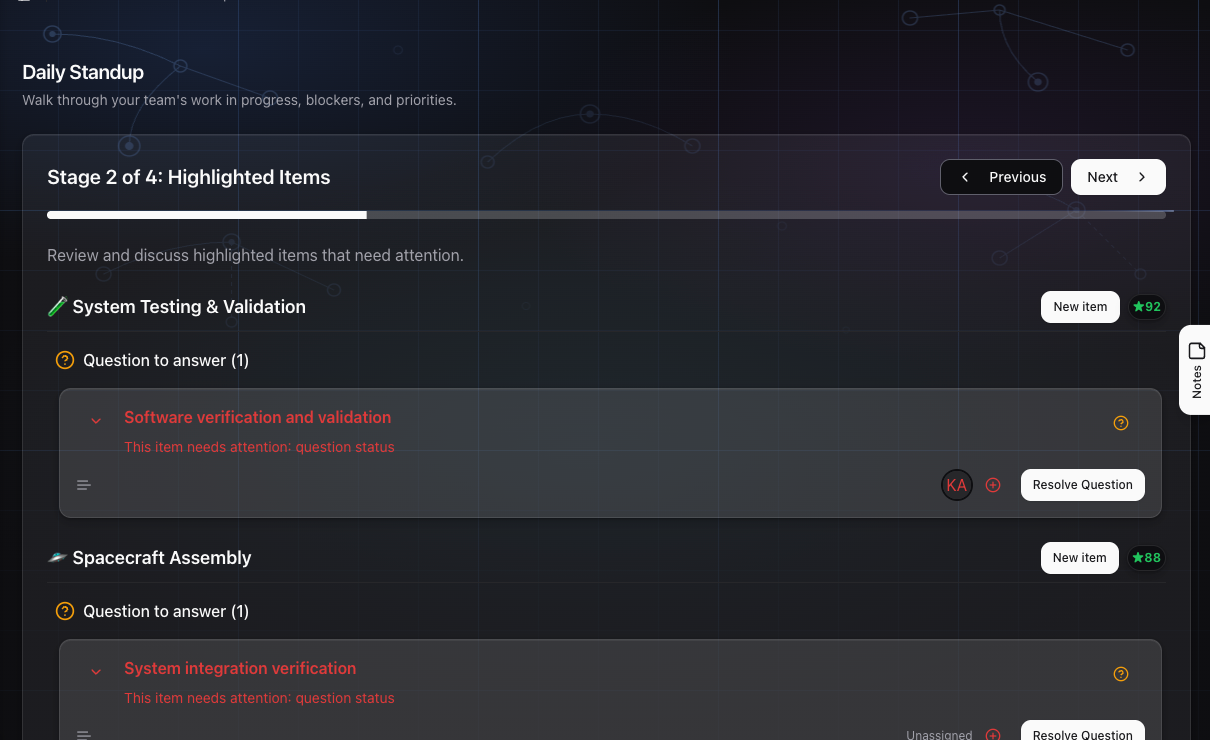
## The replaced ritual
The monthly productivity review. Every engineering organization runs some version of it. Someone pulls together a spreadsheet of commits, PRs, or story points, and the conversation becomes "are we going fast enough?" It is the wrong question, and the data never tells you why the number is what it is.
The SPACE framework reframes the question to: fast and sustainable, or fast and fragile? The three dimensions GoalPath surfaces automatically give you enough of that picture to have a real conversation. Velocity tells you the pace. WIP tells you whether the pace is sustainable. Cycle time tells you where the friction is.
The mechanism is straightforward: GoalPath's guided workflow captures structured execution data as teams work, and that data becomes the report. No one fills in a status update. No one aggregates a spreadsheet. The progress report, the forecast, and the efficiency view are all outputs of the same workflow that was already happening.
## What you still need to do yourself
The two dimensions GoalPath cannot measure for you are the two that require conversation.
Satisfaction shows up in attrition and in the quality of work before it shows up in any dashboard. The best signal is a regular one-on-one where you ask how it actually feels to be on the team right now. Not "are you blocked?" but "is the work sustainable? Do you feel like what you're building matters?"
Collaboration and culture shows up in the quality of handoffs and in how quickly the team surfaces misalignment. The best proxy is whether blockers are raised early or raised after they have already slipped a milestone. If your team tends to surface problems late, that is a collaboration signal, not a velocity one.
These two dimensions require you to show up as a manager, not just as someone who reads dashboards.
## A more complete picture
The SPACE framework is not a checklist to fill out. It is a reminder that any single number you use to describe team productivity is, at best, a rough approximation.
GoalPath covers three of the five dimensions automatically, from the same workflow data the team is generating anyway. For the other two, there is no substitute for asking.
That is a more honest way to think about productivity than velocity alone ever was.
---
**Further reading**
- [The SPACE of Developer Productivity (ACM Queue, 2021)](https://queue.acm.org/detail.cfm?id=3454124): the original paper by Forsgren et al., free to read
- [What is the SPACE framework and when should you use it? (GetDX)](https://getdx.com/blog/space-metrics/): practical breakdown of which metrics fit each dimension
- [DORA 2025 Report](https://dora.dev/research/2025/dora-report/): how AI tools are changing throughput metrics while leaving delivery stability flat
- [Activity ≠ progress](/blog/activity-progress-too-many-things-in-flight-is-the-1-reason-teams-feel-busy-but-don-t-deliver): how WIP overload makes teams look productive while delivery stalls
---
### Theory of Constraints for software delivery: find your bottleneck before hiring more people
*Published: 2026-05-28*
## The speedup instinct is usually wrong
When delivery slows down, the instinct is to do more of everything. Add a developer. Run more standups. Break tickets smaller. Push the team harder. If some is good, more is better.
Eliyahu Goldratt spent a career arguing this was exactly backwards. His book The Goal, published in 1984 and set in a factory, makes one point over and over: a system's throughput is limited by exactly one constraint at a time. Every resource that isn't the constraint has surplus capacity. Speeding it up doesn't make the system faster. It just builds up a pile of work in front of the actual bottleneck.
Software teams rediscover this constantly. They invest in faster CI pipelines, then the backlog sits in code review for a week. They hire a second QA engineer, but the bottleneck moves to staging environment availability. The constraint shifts. The improvement doesn't stick. The team is baffled.
Goldratt called this the Five Focusing Steps: identify the constraint, exploit it, subordinate everything else to it, elevate it if you have to, then repeat because the constraint will move. You don't need a factory floor to apply this. You need to know where work gets stuck.
## What a constraint looks like in software
In a physical factory, the bottleneck is obvious. One machine runs at 70% capacity while every other machine is waiting. You can see the queue building on the floor.
Software work is invisible. Items sit in "In Progress" or "In Review" and nobody has a clear view of how long they've been there, which person is overloaded, or whether the team is blocked on decisions more than execution.
The most common constraints in software delivery aren't what teams think they are. Code review is a frequent one. Not because developers are slow to review, but because too many items are open at once and reviews happen in batches rather than continuously. Staging environment contention is another. So is product approval, architecture sign-off, or the one senior engineer who's a required reviewer on every security-sensitive change.
Research on software team performance consistently shows that teams with the highest throughput aren't the ones working the hardest. They're the ones with the shortest queues and the fewest handoffs. Recent DORA research found that organizations investing in AI coding tools without first addressing their deployment or review bottlenecks often made things worse: more code was generated, but it piled up in the same constrained review and integration stages, making lead times longer, not shorter.
## Why optimizing non-bottlenecks is waste
This is the part that feels counterintuitive until you've seen it a few times.
Imagine a team where the bottleneck is code review. Developers are fast. Testing is fast. Deployment is automated. But there are only two senior engineers who do meaningful reviews, and they're also the ones running the architecture discussions, the oncall rotation, and the stakeholder demos.
You decide to hire two more developers. Now there are more pull requests, waiting for the same two reviewers. Lead time goes up, not down. Throughput stays flat. The two new developers are busy, but the system isn't faster.
Goldratt called this "local optimization." You made one part of the system more efficient. But the system's output is determined by its slowest stage, not by the average of all stages.
Exploiting the constraint, before elevating it, means squeezing more out of what you already have. If code review is the bottleneck, you don't immediately hire another senior engineer. You first ask: are reviews waiting because of process, not capacity? Could you review smaller diffs? Could you batch reviews into dedicated morning slots and stop context-switching reviewers? Could you reduce the number of things in progress so fewer reviews are outstanding at once?
Subordinating the rest of the system to the constraint means the developers should probably slow down their output rate to match what the reviewers can absorb. That's also counterintuitive. But starting new work when there's a queue in front of reviewers just grows the queue. It doesn't help.
## The Friday status call that hides the bottleneck
In most teams, the ritual that's supposed to surface this information is the weekly status call or the sprint retrospective. "How are we doing? Any blockers? What's slow?"
The problem is that people report on what they feel, not on where the work actually is. A developer who is fast but feeding into a stuck review queue feels productive. A reviewer who is overloaded but managing to work through the queue heroically doesn't want to say "I'm the bottleneck." The retrospective produces observations like "we need better communication" rather than "eight items have been in review for over two weeks."
That's what flow data is for.
## Where GoalPath makes the constraint visible
GoalPath's Velocity Analytics page has a section called Flow Metrics. It runs four numbers that, read together, tell you a lot about where your constraint probably is.
The first is Flow Time: median lead time (from creation to done), median cycle time (from started to done), and wait time (how long items sit before anyone touches them). If lead time is long but cycle time is short, items are spending most of their life waiting, either waiting to be started or sitting in review. That gap is the signal.
The second is Flow Efficiency: the ratio of active time to total lead time. Industry benchmarks put the average software team somewhere between 15% and 25%. Below 15% means three-quarters or more of an item's life is waiting, not being worked on. That's not a people problem. That's a queue problem, which is a constraint problem.
The third is Flow Load, which shows total items in progress and breaks them into aging buckets: fresh (under 3 days), normal (up to 7 days), aging (up to 14 days), stale (up to 30 days), and stuck (over 30 days). Stuck items are the most direct signal. An item that's been "in progress" for over a month isn't in progress. It's blocked on something, and that something is probably your constraint. If you have five stuck items and they all belong to the same person, you've found the overloaded node.
Flow Load also shows WIP per person. If one team member has seven items in flight while others have one or two, the work isn't actually flowing to the constraint. It's piling up with one person. That's a distribution problem, but the fix often reveals the constraint: that person is overloaded because they're the only one who can do a specific thing.
The fourth metric, Flow Distribution, breaks down what type of work is flowing (features, bugs, tasks). A team where bugs are crowding out features is often one where quality issues are the hidden constraint: defects from earlier work are consuming the capacity that should be going to new delivery.

## A practical way to find your constraint
Open the Flow Metrics view and look at the stuck count in Flow Load. If stuck is more than zero, start there. Click through to the items themselves and ask: why is this item still in progress? Who last touched it? What's it waiting for?
Often you'll find a pattern. All the stuck items are waiting for a specific person. Or they're all in the same milestone. Or they all require a specific environment that isn't available. That's your constraint.
Then look at Flow Efficiency. If it's below 15%, the team is spending most of its time waiting rather than doing. The question is: waiting on what? Cross-reference with Flow Load per person to see if the wait is concentrated around a specific bottleneck.
If wait time is high but no single person stands out, look at the Velocity Analytics section for coordination impact. GoalPath calculates a multitasking penalty when the team is spread across many active milestones simultaneously. A 30% velocity reduction from coordination overhead means the constraint might not be a person or a stage. It might be attention, spread too thin across too many parallel tracks of work.
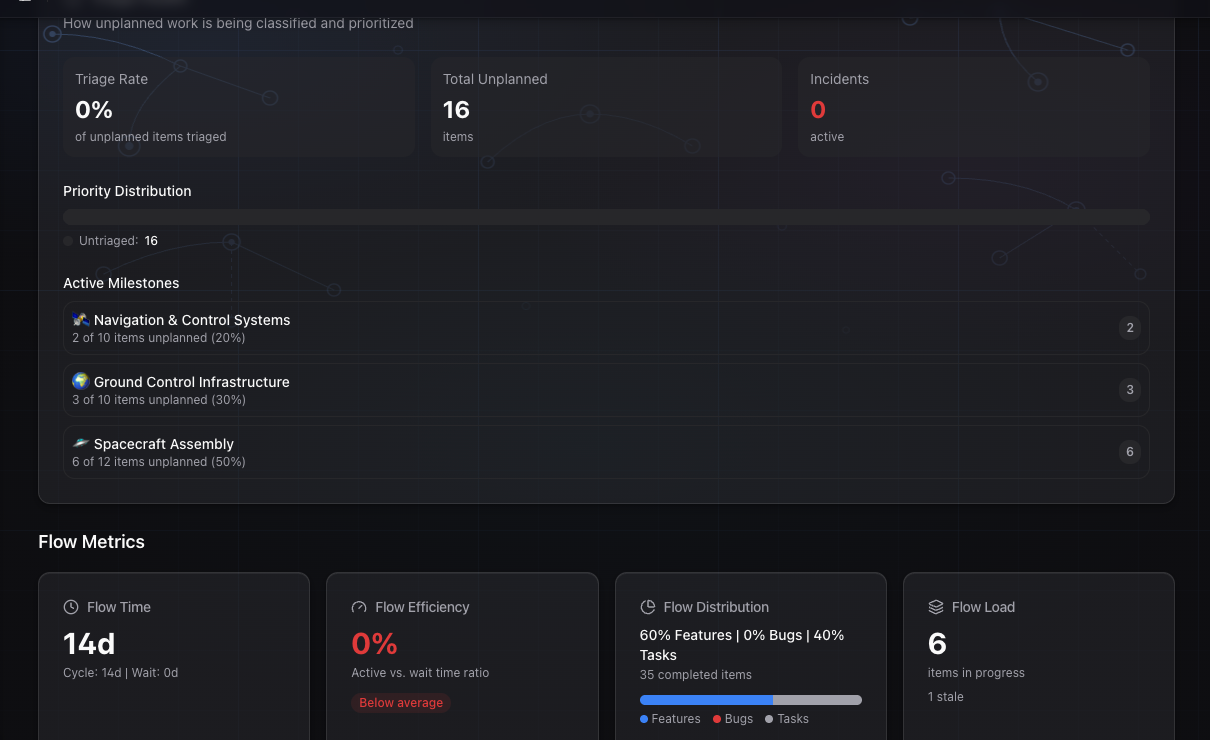
## What to do once you find it
The constraint dictates the system's throughput. Your job is first to exploit it: get more out of it without spending more. Then subordinate: don't start work faster than the constraint can absorb it.
If code review is the constraint, that means:
- Keep the review queue short, even if it means developers start fewer things
- Clear the oldest reviews first, not the newest (FIFO, not LIFO)
- Make the reviewer's time protected and uninterrupted
- Reduce diff sizes so reviews take less time per item
If architecture sign-off is the constraint, document the decision patterns so not every PR needs senior involvement. Pull the architect upstream to the design stage, not downstream to the review stage.
If staging availability is the constraint, shift work-in-progress limits upstream so fewer things compete for staging slots.
Goldratt's last step, repeat, is the one teams most often skip. When you break one constraint, a new one emerges somewhere else in the system. That's expected and fine. It means the system is improving. The point isn't to find a permanent bottleneck. It's to keep finding the current one and focusing effort there, instead of spreading it everywhere.
## The ritual this replaces
Most teams replace "where are we?" with a weekly status call where people report on how busy they feel. GoalPath replaces that call with data. Flow metrics are calculated from actual item movement: when things were started, how long they sat, whether they're still moving. The weekly progress report GoalPath generates draws on the same underlying data.
The mechanism is straightforward: when your team moves work through GoalPath's guided workflow, every status transition is recorded. That data aggregates into the flow metrics, which are recalculated weekly. Instead of asking "is anyone blocked?" in a meeting, you look at the stuck count and the per-person WIP. The constraint is visible before it becomes a crisis.
## Further reading
- Goldratt, E.M.: [The Goal: A Process of Ongoing Improvement](https://www.tocinstitute.org/theory-of-constraints.html) (Theory of Constraints Institute overview)
- IEEE Xplore: [Bottleneck Identification in Software Development Processes: A Proposal Based on the Principles of the Theory of Constraints](https://ieeexplore.ieee.org/document/7227532/)
- DORA: [State of DevOps Report 2024](https://dora.dev/research/2024/dora-report/), especially the finding on AI amplifying existing constraints
- Planview: [Flow Metrics Business Leader Guide](https://info.planview.com/rs/456-QCH-520/images/flow-metrics-business-leader-guide_ebook_rbd.pdf)
---
### DORA Metrics: Engineering Performance Benchmarks
*Published: 2026-05-21*
## You don't need a DORA dashboard to understand your delivery health
If you have been around engineering teams for a while, you've probably watched this play out: leadership asks how the team is performing, and someone opens a spreadsheet. They count PRs merged this sprint, maybe check Jira for cycle time, pull GitHub stats for deployment count. An hour later, there's a slide deck with five different numbers that don't quite agree.
DORA metrics exist to fix that. The four keys give teams a shared vocabulary for engineering performance. But most DORA explainers stop there: "here's what to measure, go instrument your pipelines." The part that's harder to find is what the numbers actually mean day-to-day, what good looks like, and how to get the signal without running a separate measurement program.
If you're already running work through GoalPath, a lot of that signal is already there. This post maps the four keys to what GoalPath tracks, shows where the gaps are, and explains what Elite performance actually requires.
## The four keys, plainly
DORA (DevOps Research and Assessment) identified four metrics that consistently predict both software delivery performance and organizational outcomes. The research has been running since 2014, with annual State of DevOps reports from Google Cloud. The four are:
**Lead time for changes.** How long does it take from code committed to code running in production? This includes review, testing, merge, and deploy. Elite teams get under one day. Most teams take between one day and one week. The long tail (one to six months) is more common than people expect.
**Deployment frequency.** How often do you ship to production? Elite teams deploy on demand, multiple times per day. Medium performers deploy somewhere between once per week and once per month. Low performers deploy once per month or less. The gap between elite and low is enormous: 182 times more deployments per year.
**Change failure rate.** What percentage of changes cause a production incident or require a rollback? Elite teams stay under 15%. The DORA data shows the largest cluster of teams sitting at 8-16%, which sounds manageable until you realize what it means for cumulative incident load over a year.
**Mean time to restore.** When something does go wrong, how fast do you recover? Elite performers restore in under an hour. More than half of teams in the 2024 report took between one day and one week, which means customers are affected for days, not minutes.
The 2025 DORA report moved away from the four-tier classification (low/medium/high/elite) toward seven team archetypes, which reflects how much variance exists in real teams. But the core measurements haven't changed, and the performance gaps between strong and weak teams are as large as ever.
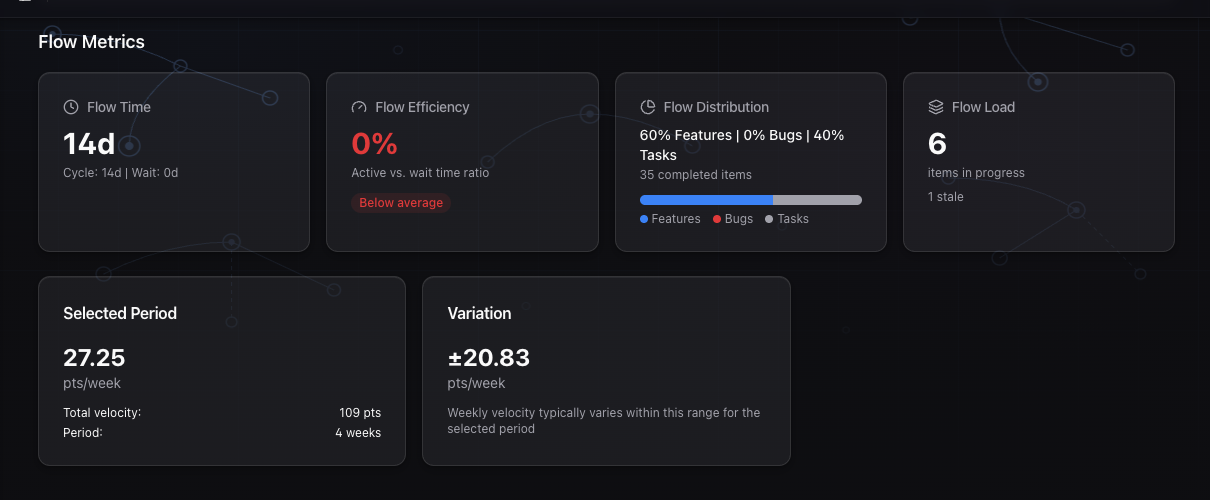
## Where DORA runs into product teams
DORA was designed for teams with continuous deployment pipelines. Every metric assumes "deploys to production" as the unit of work. That works well for API services and web apps with mature CI/CD. It works less well for teams shipping iOS apps on a two-week App Store review cycle, or SaaS products where "deploy" means "merge to main and wait for a release train."
Product teams also rarely have the tooling to instrument these metrics accurately. Lead time for changes requires correlating a commit timestamp to a production deploy timestamp. Change failure rate requires tagging incidents to specific deployments. These are engineering-level metrics that require investment to collect cleanly.
That's not a reason to ignore DORA. It's a reason to understand what you can measure with the tools you already have, and where to approximate.
## How GoalPath maps to the four keys
GoalPath tracks work at the item level, from when an item is created and started through to when it's finished and delivered. That workflow captures most of what DORA wants to know, in a form product teams can actually use.
### Lead time for changes → Flow Time
GoalPath's Flow Time metric shows you two numbers: lead time (from item creation to delivery) and cycle time (from when work actually started to delivery). DORA's "lead time for changes" is closest to cycle time (the active development window). But lead time is what your stakeholders feel.
The Insights page shows both, plus wait time (the gap between creation and when anyone picked it up). A team with cycle time of 2 days and wait time of 12 days isn't a fast team. The work is just waiting to be started.
Elite DORA teams get lead time under one day for a code change. For product feature work, "under one day" is usually not realistic. Features take longer than hotfixes. The useful comparison is your own trend over time. If your median flow time is improving month over month, you're moving toward elite behaviors even if the absolute number is higher.
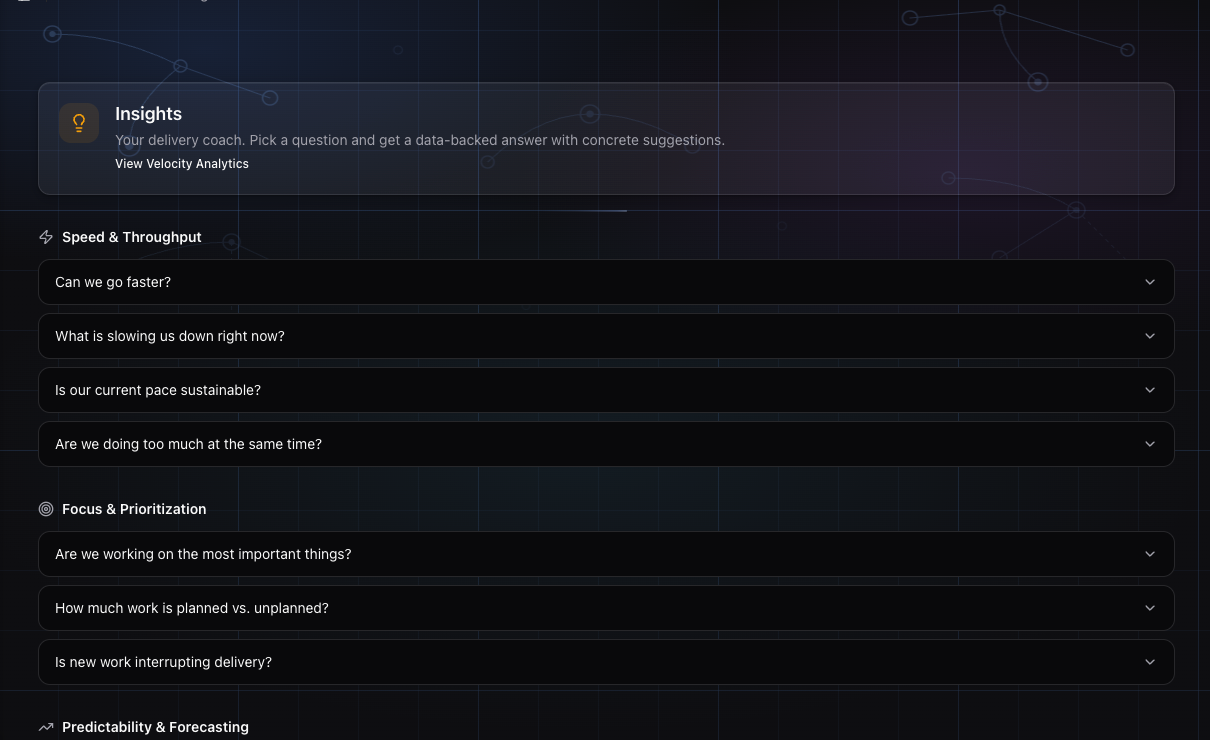
### Deployment frequency → Velocity and throughput
DORA's deployment frequency measures how often you ship to production. GoalPath's velocity measures how many story points your team completes per work week. They're related but not identical.
A team with high deployment frequency and low velocity is shipping frequently but not much. A team with high velocity and low deployment frequency is building fast but releasing slowly, which often means large, risky batches.
The useful signal from GoalPath's velocity chart is throughput: how many items are you finishing each week, and is that trend stable or erratic? Erratic throughput (big weeks followed by dead weeks) often signals the same problems that hurt deployment frequency: large items, review queues, dependencies waiting for other teams.
If your throughput is consistent week over week, you're exhibiting one of the core behaviors of high-frequency deployers: steady, predictable flow instead of batch-and-release.

### Change failure rate → Bug ratio in Flow Distribution
This is the trickiest mapping. DORA's change failure rate is specifically about production incidents caused by a deploy. GoalPath doesn't monitor your production environment. It manages your planned work.
What GoalPath does track is Flow Distribution: the split of completed items across Features, Bugs, and Tasks. If your team is completing 40% Bugs in a given period, that's a signal. You're spending nearly half your capacity on things that were already shipped and broke.
High bug ratio in Flow Distribution is a leading indicator of high change failure rate. Teams that ship quality problems generate rework. That rework shows up as the next sprint's bug list before it ever shows up in a DORA dashboard.
Healthy teams in the DORA data tend to have low rework ratios. In Flow Distribution terms, that usually means bugs staying below 15-20% of completed work. It's not a hard benchmark (a team doing active maintenance on a legacy codebase will skew higher), but the trend matters. If bugs as a percentage of completed work are increasing quarter over quarter, your change failure rate is probably climbing too.
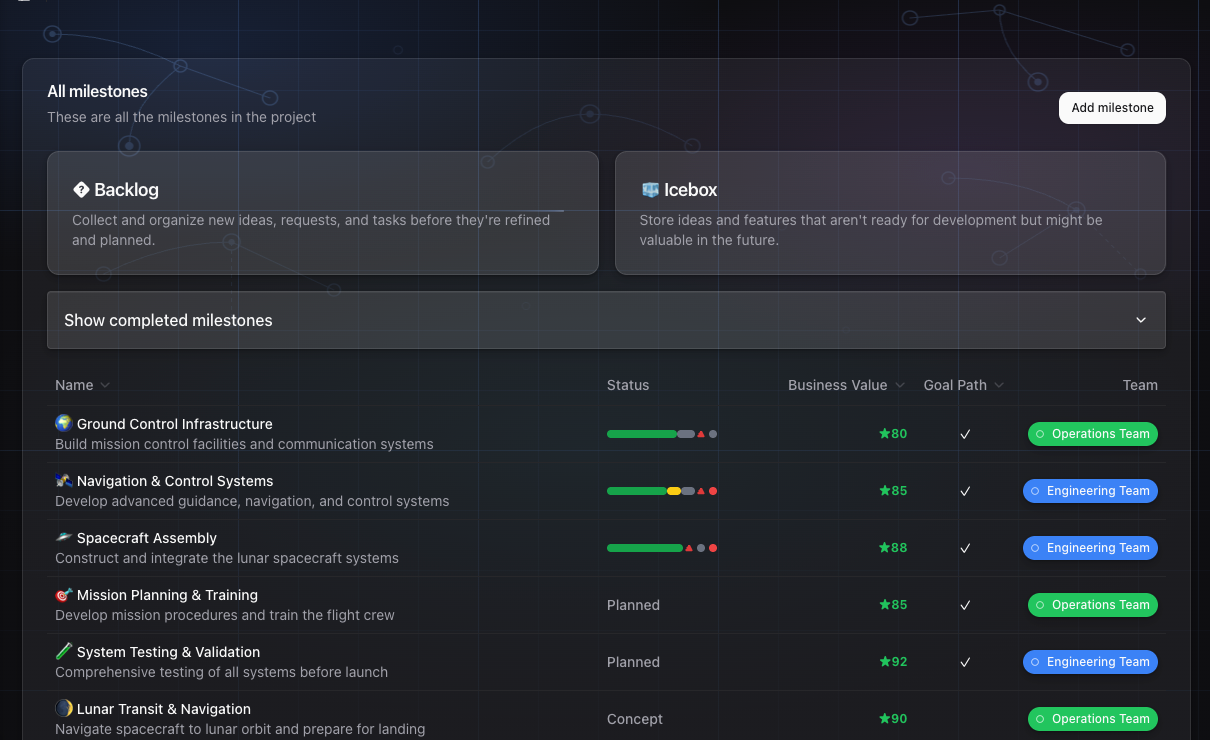
### Mean time to restore → Item aging in Flow Load
DORA's MTTR measures how fast you recover from a production incident. GoalPath doesn't track incidents, but it does track aging WIP items and how long they've been in progress.
Flow Load shows you items currently in progress and how many are stale or stuck. A stuck item is one that has been in progress for more than 30 days. Stuck or stale items are often held up by external dependencies, unclear requirements, or decisions waiting on stakeholders.
The analogy to MTTR isn't perfect. Stuck feature work isn't the same as a production outage. But the capability that drives fast MTTR is the same capability that clears stuck or stale items fast: clear ownership, fast decision-making, and a culture where problems surface quickly instead of aging silently.
Teams that let items sit stuck for weeks are usually the same teams where incidents last days. The organizational habits that create long MTTR create long item aging. Watching Flow Load gives you early warning before the incident queue tells you about it.

## What Elite actually requires
The DORA data shows that 19% of teams reach elite performance on the four keys. What makes the difference is not tooling. It's a set of organizational practices that elite teams have and lower performers don't.
**Small batches.** Elite teams ship small changes frequently. They don't accumulate two weeks of work into a large release. Small batches mean smaller blast radius when something goes wrong, faster cycle times, and easier rollbacks.
**Deployment confidence.** Teams that deploy multiple times per day have invested in automated testing and deployment pipelines. They don't deploy manually. They don't have a "release manager" who coordinates deploys. The pipeline does it.
**Fast feedback loops.** Elite teams know within minutes if a deploy caused a problem. Staging environments don't cut it. You need production observability.
**Decision speed.** This is the one GoalPath can help with directly. A common source of long lead times and stuck items is not technical complexity. It's slow decisions. Whose sign-off is needed? Who reviews this change? Who decides if this is good enough to ship? Teams where those answers are unclear will struggle to hit elite performance regardless of their deployment infrastructure.
## The ritual GoalPath replaces
The typical DORA measurement program looks like this: someone in engineering leadership decides the team needs metrics, they instrument a data pipeline, pull data from GitHub and Jira, build a dashboard in Grafana or Tableau, and run a quarterly review.
Three months later, no one is looking at the dashboard. The quarterly review doesn't change anyone's behavior. The data is accurate but not actionable.
GoalPath doesn't replace DORA instrumentation for teams that need it. If you have dedicated SREs and are deploying fifty times a day, you need proper observability tooling. But for product teams of five to twenty engineers who just want to understand whether their delivery health is improving or degrading, GoalPath's flow metrics page gives you the signal you need from work your team is already doing.
No additional instrumentation. No separate dashboard. No quarterly review cycle. The metrics update as items move through your workflow, and the weekly progress report surfaces the trends automatically.
If something is wrong (flow time is climbing, bug ratio is up, five items have been stuck for three weeks), the Insights page shows it. You can act on it in this week's planning instead of discovering it in a quarterly report.
## Further reading
- DORA's official four keys guide: [dora.dev/guides/dora-metrics-four-keys](https://dora.dev/guides/dora-metrics-four-keys/)
- 2025 DORA report (AI's impact on delivery metrics): [dora.dev/research/2025/dora-report](https://dora.dev/research/2025/dora-report/)
- Octopus Deploy's breakdown of the 2024 performance clusters: [octopus.com/devops/metrics/dora-metrics](https://octopus.com/devops/metrics/dora-metrics/)
- RDEL newsletter on 2025 DORA benchmarks: [rdel.substack.com/p/rdel-115-what-are-the-2025-benchmarks](https://rdel.substack.com/p/rdel-115-what-are-the-2025-benchmarks)
---
### Getting started with GoalPath: guides for every role
*Published: 2026-05-14*
When a new tool lands on a team, everyone goes to the same onboarding doc and reads about every feature. Half of it doesn't apply to them. Half that does, they don't realize applies to them. Then they go back to whatever they were doing before.
GoalPath has three very different types of users. What the tech lead needs to look at every morning is completely different from what the CEO needs to look at on Thursday before the board call. So instead of one generic "getting started" guide, here are three short ones.
A quick note on role names: in GoalPath, a tech lead is typically a **ProjectLeader** or **Collaborator**. A product owner is usually the project **Owner**. **Stakeholders** and **Viewers** both have read-focused access, but with different levels of participation. Stakeholders can vote in alignment meetings, Viewers cannot.
---
## For the Tech Lead
**What GoalPath does for you:** It replaces the "where are we on this?" Slack messages and the Monday status meeting with a dashboard you can check in 60 seconds, and a weekly report that writes itself.
You are the person who actually knows what is happening. You just spend a lot of time translating it for everyone else. That is the problem GoalPath fixes.
### What to look at every day
Open the **project dashboard**. You want to see two things:
First, how many items are currently in progress. If the WIP count is climbing (people starting new things before finishing old ones), that is the first sign a milestone is going to slip. You do not need to wait for a retrospective to notice it.
Second, glance at the **milestone forecast**. GoalPath calculates this from your actual delivery velocity over the past six weeks. If something shifted since yesterday, you will see it there. The forecast panel shows you the numbers. If the expected date moved, the weekly progress report will include an explanation of why.

### What to look at in your first week
**Velocity Analytics page.** This is accessible via the sidebar. You will see your team's rolling average story points per work-week, with a variance band. Flow metrics also appear on the **Insights** page. Do not try to optimize it on day one. Just look at it. Is velocity consistent? Wildly variable? That tells you more about your process than any sprint review.
**The roadmap.** GoalPath shows milestones as a dependency graph, not a Gantt. You can see the critical path: which milestones are blocking what. If you are three milestones deep into a chain and the first one has a bloated WIP count, you now know your actual problem.
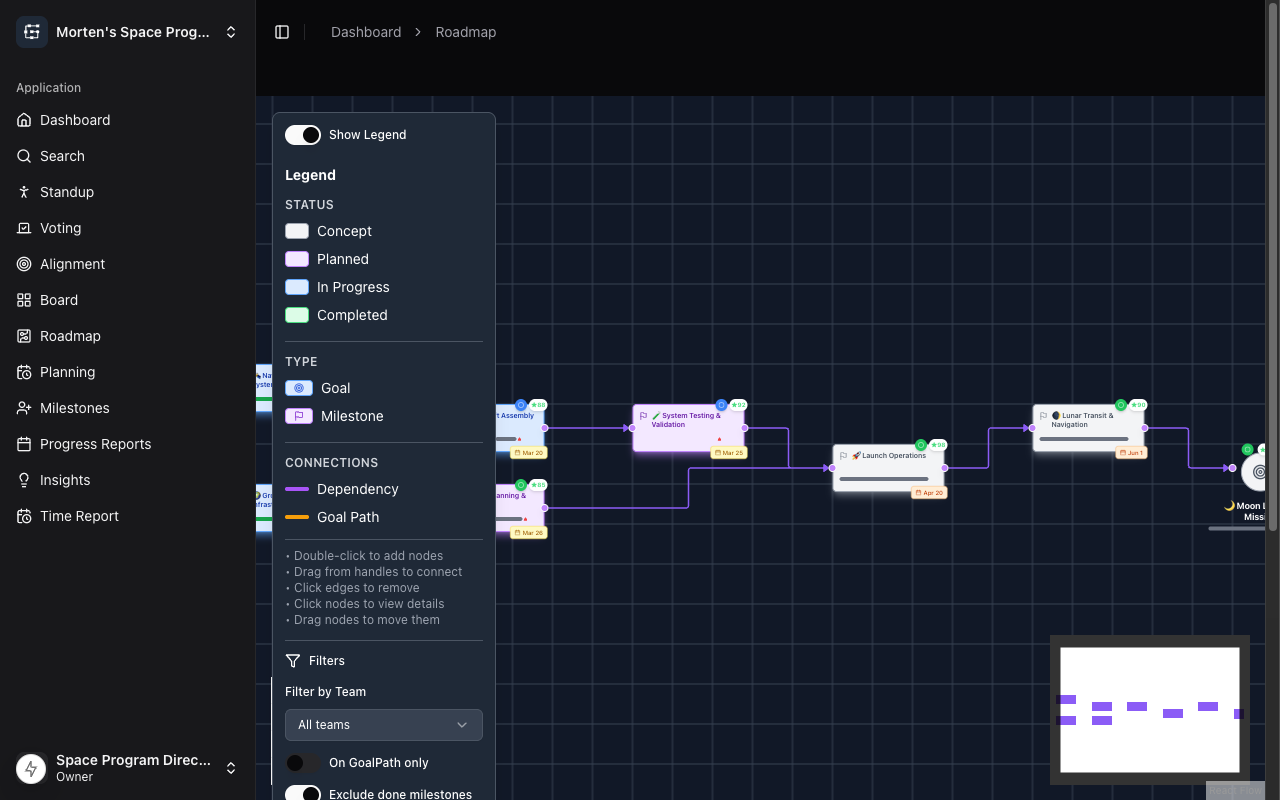
**Progress report preview.** By the following Sunday (the cron runs Sunday nights), a draft progress report will be generated automatically from what your team shipped. Read it. If something is wrong or missing, that tells you something about how items are being structured or closed out. Once you trust the drafts, reviewing them before sending takes about two minutes.
### The thing most tech leads miss
GoalPath uses guided standup and alignment meetings. You do not need to facilitate these from scratch. The interface walks through the stages: what shipped, what's blocked, anything unplanned that crept in. The blockers surface automatically. You do not need to ask. Note that the guided standup is available to team members with edit access: Owners, ProjectLeaders, and Collaborators.
If you are spending more than fifteen minutes per day in status-related conversations, something is not set up right. The tool is supposed to absorb that.
---
## For the Product Owner
**What GoalPath does for you:** It turns your roadmap from a Google Sheet that is wrong by Tuesday into a live dependency map that updates itself. And it gives you an automatic progress report every week that you can share with leadership without spending your Friday afternoon writing it.
### What to look at in your first week
Start with the **roadmap view**. Add your milestones. Connect the dependencies. GoalPath will show you the critical path automatically: which things have to happen before which other things. This is the conversation you normally have in a planning meeting, except now it is just visible.

The **alignment meeting flow** is where GoalPath earns its keep. Alignment meetings in GoalPath have six structured stages: progress snapshot, Flow Health & Escalation, business value voting, roadmap brainstorming, roadmap update, and a summary. You do not need to design the meeting format. The tool runs it. What you get out is an ordered priority list that the whole group participated in creating, which means you spend less time defending decisions afterwards.
Business value voting is the part worth highlighting. Instead of whoever is loudest in the room deciding what comes next, GoalPath collects votes from your stakeholders using a structured framework: Impact/Effort, RICE, MoSCoW, or a configurable weighted scoring framework. It normalizes the scores to a 1–100 scale. All of a sudden you can sort the roadmap by business value instead of by who pinged you last on Slack.
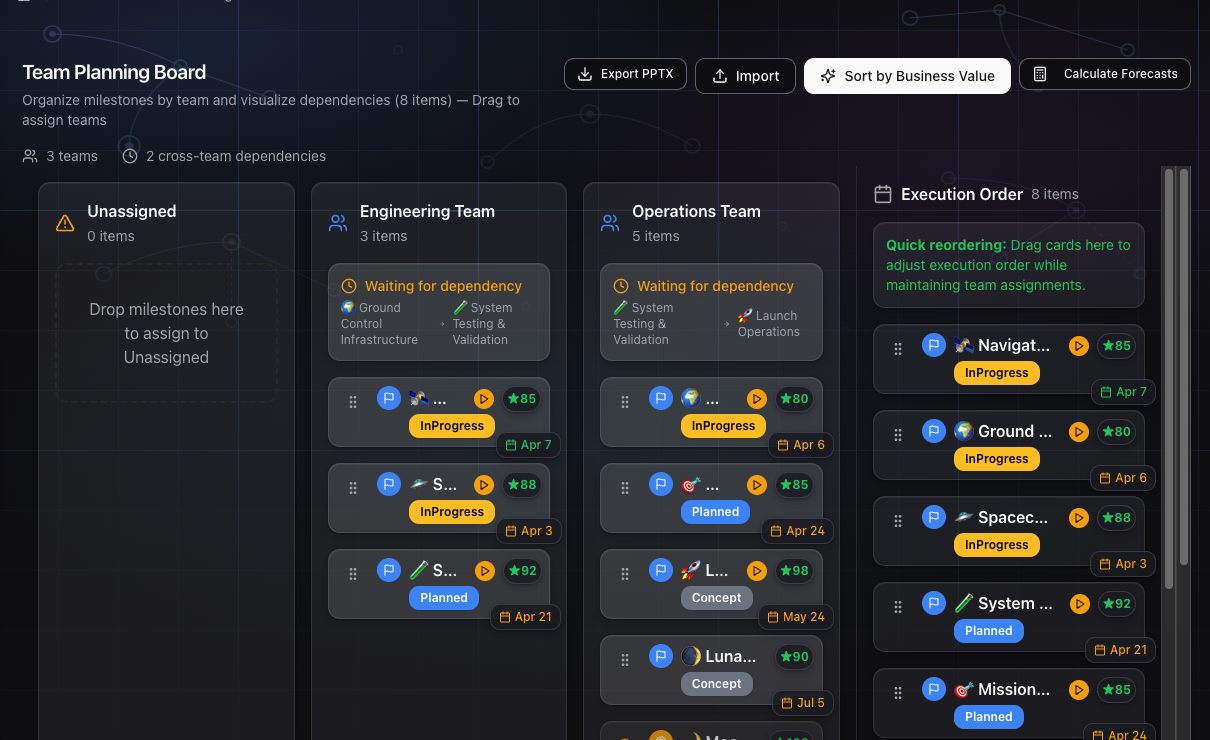
### The replaced ritual to notice
You will have a Friday or Monday ritual right now: either writing a status email, or running a sync where someone summarizes what happened last week. Both of these go away. GoalPath generates the progress report draft from execution data (what shipped, what is blocked, how forecasts changed) every week. You review it, make any edits you want, and send it. The whole thing takes a few minutes.
Your stakeholders stop asking "where are we?" because they already know.
### For alignment meetings: stop prepping slides
The classic product owner move is to spend two hours before a planning meeting building a slides deck to show the roadmap. You do not need to do this. The GoalPath roadmap is the meeting. Pull it up, work through the stages, done.
---
## For the Stakeholder or Viewer
GoalPath distinguishes between two read-focused roles: **Stakeholders** participate in alignment meetings, including voting on business value priorities. **Viewers** can observe alignment meetings but do not vote. Both receive progress reports and can see the project roadmap and forecasts.
**What GoalPath does for you:** It means you stop having to ask. You get a plain-English progress update every week that tells you what shipped, what is behind, and when things are expected to be done, without needing to understand what "velocity" or "story points" means.
GoalPath is designed so you should not need to understand lean delivery methodology to know what is happening. The team's work gets turned into something readable. That is the whole point.
### What to look at in your first week
**The weekly progress report.** This is your primary artifact. It shows up automatically, generated from actual work data, not from what someone remembered to write down. The AI-generated report typically covers what shipped, what is blocked, forecast changes (if the expected delivery date moved, it says so and by how much), and items that need attention or a decision from you.
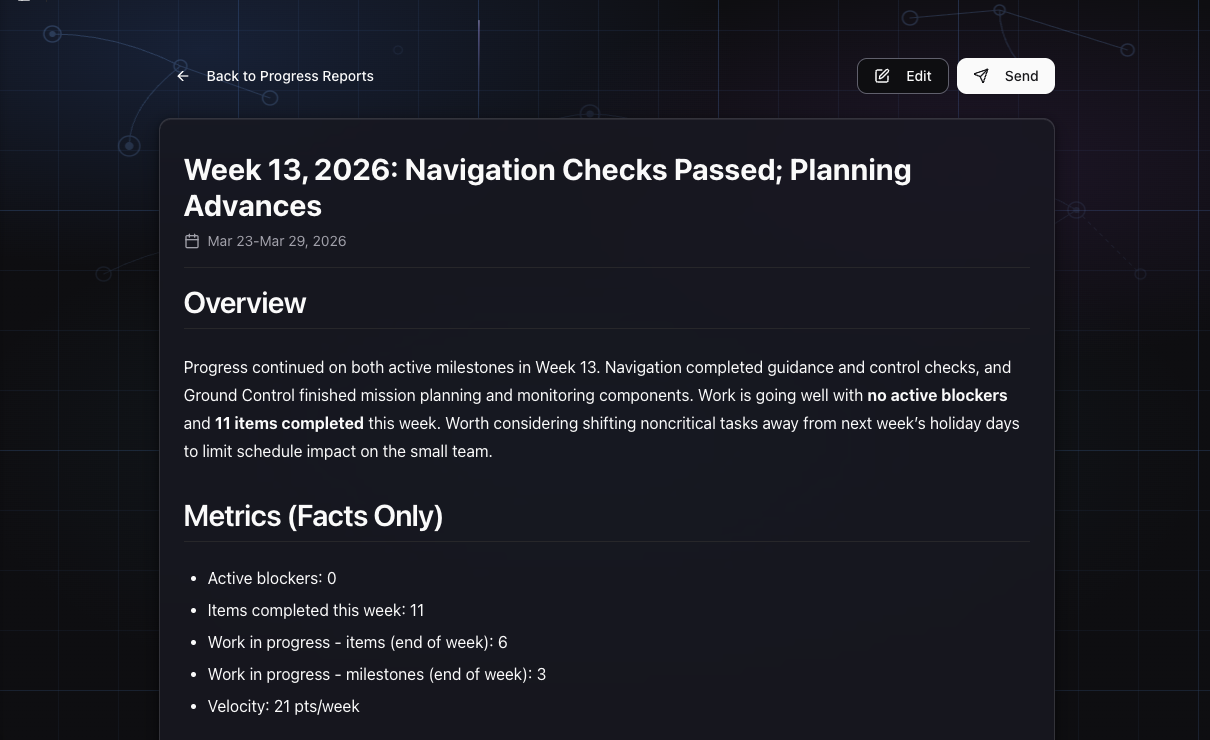
That last section is the important one. GoalPath surfaces items that are waiting on a stakeholder decision. You do not need to dig through a Jira board to find them. They are right there.
### Understanding the forecast
GoalPath shows three forecast scenarios for each milestone: Optimistic, Most Likely, and Pessimistic. These are calculated from actual delivery velocity, not from someone's guess in a planning meeting.
If the expected date moves, you will see it in the progress report. The forecast panel shows the updated numbers; the weekly progress report is where you will find an explanation of what changed and why. The forecast is based on what the team has actually been delivering, so when it moves, it usually means something real happened: someone got blocked, a dependency shifted, scope changed.
You do not need to interrogate anyone about timelines. The number is in the forecast panel. If you want to understand why it changed, the explanation is in that week's progress report.

### When to actually open GoalPath
Most stakeholders do not need to check GoalPath every day. Here is a simple pattern:
- Read the weekly progress report when it arrives (Monday morning typically). Two minutes.
- If there is an item flagged as needing your decision, handle it before end of day.
- Before a board meeting or investor call, open the project and look at the forecast panel. You will have everything you need.
That is it. You do not need to understand the velocity chart or the roadmap dependency view. Those are for the tech lead and product owner. Your interface is the progress report.
---
## Starting as a team
One thing that helps all three roles is doing the first **alignment meeting** together in week one. GoalPath walks you through it. The product owner drives, the tech lead provides technical context, stakeholders vote on business value. Everyone leaves knowing the priority order, and they all participated in setting it.
That single meeting often replaces three or four recurring syncs that have been happening on autopilot.
After that, the rhythm is: team works in GoalPath, progress report generates itself Sunday night, everyone reads it Monday morning, nobody needs to ask "where are we?"
That is the goal. Not perfect process. Just shared reality, automatically.
---
## Further reading
- [Understanding velocity metrics in GoalPath](/blog/understanding-velocity-metrics): how the forecasting math works
- [When everything is Priority 1, teams default to the loudest work](/blog/when-everything-is-priority-1-teams-default-to-the-loudest-work): why structured prioritization beats gut feel
- [Too many things in flight](/blog/activity-progress-too-many-things-in-flight-is-the-1-reason-teams-feel-busy-but-don-t-deliver): WIP monitoring and what the tech lead should watch for
- DORA 2025 report on team performance:
---
### Reading your forecast: what the probability bands actually mean
*Published: 2026-05-07*
Someone asks "when will this ship?" and you feel the familiar pull to just give them a date. Pick something that sounds reasonable. A date that won't cause immediate alarm. You know in the back of your head it's optimistic, but the alternative (explaining uncertainty, talking about velocity variance, asking them to hold two dates in their head at once) feels harder than it's worth.
So you say "end of the quarter" and hope for the best.
Most teams I've talked to have been doing some version of this for years. Not because they're dishonest, but because the tooling trained them to think in single dates. You open your project management tool, there's a due date field, you put a date in it. Forecast delivered.
The problem is that a single date is not a forecast. It's a guess dressed up as a commitment.
## What actually drives delivery time
Before getting into what the numbers mean, it's worth being precise about what determines when something ships.
The short version: remaining work divided by the rate at which the team completes work. That's it. The math is not complicated.
The hard part is that both inputs have variance. Remaining work changes. Scope creep is not an exception, it's the norm on most software projects. And team velocity fluctuates week to week. Some weeks the team ships 12 points, some weeks they ship 6. Bugs, sick days, an unexpected architecture decision, a dependency that wasn't ready. Real teams are not machines that run at constant throughput.
When you divide a changing numerator by a variable denominator, you don't get a date. You get a distribution. Some outcomes cluster around a central value, some skew later, occasionally things go faster than expected. Pretending otherwise doesn't make the uncertainty go away. It just hides it until the date passes.
Research on the planning fallacy (Kahneman & Tversky) confirms that humans systematically underestimate how long things will take, even when they have prior experience with similar tasks. For software projects specifically, research suggests underestimates often run 40–60%. This is not a failure of individual competence. It's how human cognition works. You focus on the task ahead, not on everything that went sideways last time.
A good forecast system doesn't fight human nature by asking people to estimate better. It uses actual delivery history to build the range automatically.
## The three scenarios GoalPath shows you
When you open the forecast panel on a milestone in GoalPath, you see three completion dates, not one. Optimistic, Most Likely, and Pessimistic. Each one represents a different assumption about how the remaining work will go.

**Optimistic** is not "best case if everything goes perfectly." It's best case based on the upper end of your actual velocity history. GoalPath calculates this using your team's velocity at the upper range of its recent performance: the kind of output you've actually hit in good weeks, not a projection of what you could theoretically do. It is an achievable outcome, not a fantasy.
**Most Likely** is the central estimate, built from your average (effective) velocity adjusted for real-world factors: how many milestones the team is running in parallel (multitasking reduces effective velocity), the historical rate of scope additions to this type of work, and how many items in the milestone still lack estimates. This is the number you'd bet on if you had to pick one.
**Pessimistic** is not "what if everything goes wrong." It's what happens when the team runs at the lower end of its demonstrated velocity, accounting for the same adjustment factors. A realistic bad-week scenario, not a catastrophe.
The width of the range tells you something important: how predictable this milestone is. A forecast that shows Optimistic on March 12 and Pessimistic on March 13 means the remaining work is small and well-understood. A forecast showing March 12 and April 28 means there's real uncertainty: too many unestimated items, high velocity variance, or both. The range is not a bug in the display. It's the most useful information in it.
GoalPath shows you the calculation behind these numbers if you want to dig in. Click "Calculation Details" and you can see the effective velocity (post-penalty), the standard deviation, the multitasking penalty if one applies, the reactive planning buffer derived from your historical scope additions, and the exact formula used. This is not magic. It's arithmetic applied consistently to your actual delivery data.
## The delivery probability lines in your item list
Inside a milestone's item list, you'll notice thin colored horizontal lines appearing between items. These are delivery probability lines, and they're the most useful tool in GoalPath for having scope conversations.
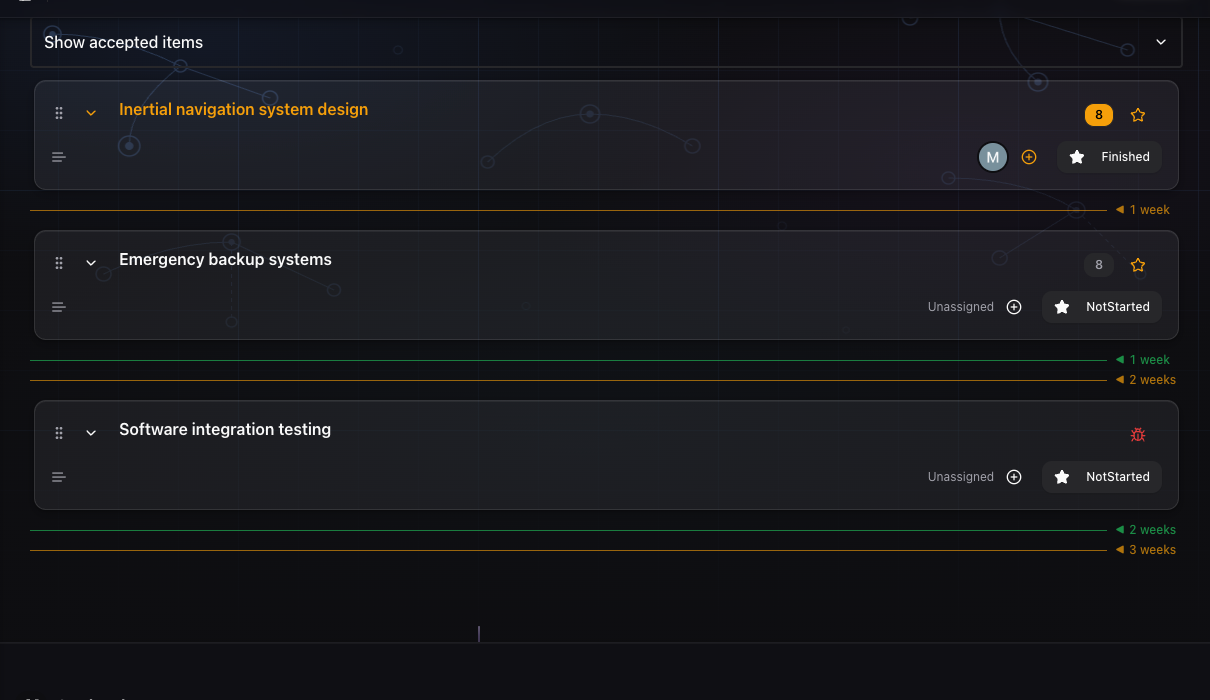
The concept is straightforward. GoalPath takes your three velocity scenarios and asks: if the team works through this list in priority order, at optimistic/probable/pessimistic velocity, which item will be the last one delivered by the target week?
The green line is **Best Case**. Items above it will likely ship by the optimistic date.
The amber line is **Probable**. Items above it will likely ship if the team performs at its expected rate.
The red line is **Worst Case**. Items above it will likely ship even if things go slower than usual.
Items that fall below the red line have a meaningful probability of not shipping in the current cycle at all.
This changes the conversation with stakeholders. Instead of "we think we'll ship all of this," you can point to the screen and say: "these six items are above the amber line, which means they'll ship on the expected scenario. These three are between amber and red, which means they'll ship if things go reasonably well but might slip. These two below the red line are uncertain and we should talk about whether to cut them or push the timeline."
That conversation takes about two minutes. The alternative, where you guess at a date and then explain a slip two weeks before delivery, takes much longer and damages trust in a way that's hard to recover from.
## What confidence level means
The confidence badge in the forecast panel (High / Medium / Low) reflects how variable your team's velocity has been over the measurement window. It tells you how much to trust the forecast range. It doesn't add a separate buffer on top of it.
High confidence means velocity has been consistent: the standard deviation is low relative to the average (under 50%). The gap between optimistic and pessimistic dates will be narrow, and the range is fairly reliable.
Medium confidence means moderate fluctuation. Velocity variance is in the 50–70% range. You'll see a wider spread between the three scenarios, and there's more room for surprise in either direction.
Low confidence means high variance, or that GoalPath fell back to global or historical velocity data instead of team-specific data. When the system doesn't have enough dedicated team velocity (fewer than 5 recent completed items from a dedicated team), it falls back to project-wide or historical averages, which caps confidence at Medium or Low regardless of variance. The uncertainty factors in the Calculation Details panel will tell you exactly why.
When you see a low-confidence forecast, the answer is not to distrust GoalPath. The answer is to ask why the variance is high. Usually it's one of two things: items in the milestone lack estimates (easy fix: add them), or the team is spread too thin across parallel work (harder fix, but worth addressing). The confidence badge is a diagnostic, not just a label.
## How to use this in stakeholder conversations
The ritual GoalPath replaces here is the "when will this ship?" conversation where you improvise a date, stakeholders write it down, and everyone moves on hoping for the best. That ritual generates false precision and erodes trust when reality doesn't match the improvised date.
The replacement is not more complex. Pull up the milestone forecast panel or the item list and walk through the three scenarios together. It takes about two minutes. Something like:
"Our expected delivery is [Most Likely date], assuming normal velocity. Best case it could be as early as [Optimistic date]. If we hit the kind of delays we sometimes see, such as scope creep or a tricky dependency, it might push to [Pessimistic date]. The high-priority items are expected to ship even in the pessimistic scenario. These lower-priority ones are at risk if things go slowly. Do you want to talk about scope, or should we plan around the pessimistic date?"
Notice what this does: it replaces "we'll ship on X" with "here's the range and here's what determines where we land." It invites stakeholders into a trade-off conversation rather than a date negotiation. It makes scope the variable, not your credibility.
Most stakeholders respond well to this once you do it a few times. The initial discomfort ("why can't you just give me a date?") is mostly habit. When they see that the range comes from real data and that the tool updates automatically as the team delivers, the trust actually goes up, not down.
The key is to be consistent. Use the range every time. Don't give single dates in Slack and then pull out the range only when things are going badly. If the range is your communication standard from the beginning, it becomes the shared reality the team and stakeholders work from.
## When forecasts should change your plan, not your date
One thing teams sometimes miss: GoalPath recalculates forecasts whenever something significant changes. Items completed, new items added, velocity changes over the measurement window. The forecast is not set at the start of a milestone and then compared to reality at the end. It's a live reading of where you stand.
If you check the forecast today and it says the pessimistic date is after a commitment you've made to a customer, that's not a forecast failure. That's the forecast working exactly as intended. Not knowing is worse.
The right response to a forecast that shows a date you don't like is not to question the forecast. It's to look at the item list, find what's above and below the probability lines, and decide whether to cut scope, add capacity, or have a timeline conversation now rather than in three weeks when there's no room to maneuver.
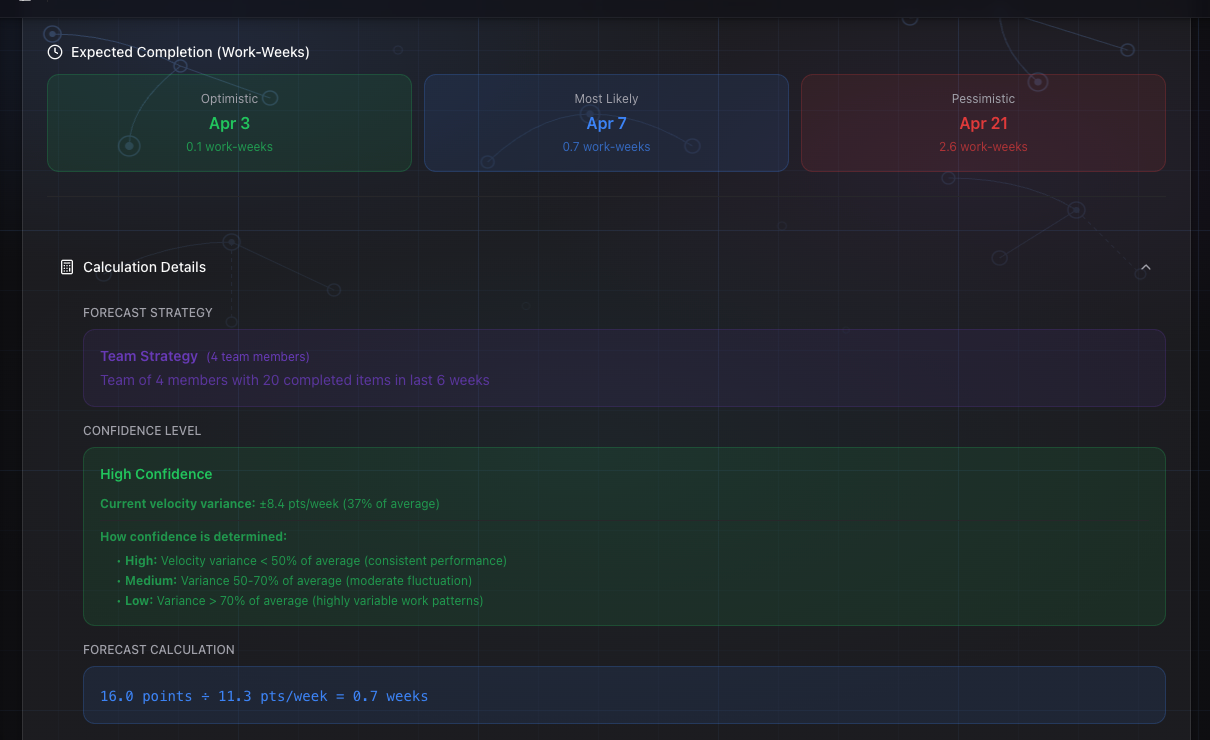
## The math is not the hard part
I want to be honest about where this actually gets difficult. It's not the math. GoalPath handles the math. The hard part is the organizational habit change.
Teams that have been doing date-picking for years will initially feel that probability bands are evasive, even when they're more honest. Some stakeholders will push back. Some PMs will feel exposed when the range is wide because it makes visible the uncertainty they were previously hiding with a single number.
The discomfort passes. What doesn't pass is the slow erosion of credibility from repeatedly promising dates you can't keep. Three-point forecasts, used consistently, build a different relationship with stakeholders over time. One where they trust the numbers because the numbers have been right about the range, even when they weren't right about the single date.
GoalPath is opinionated about this. There's no single-date forecast, no due date field you fill in manually. The forecast comes from the data, not from what you think will make a stakeholder happy this week. That's a choice, and it reflects a belief that honest uncertainty is more useful than false precision.
A range is not a hedge. It's the most accurate thing you can say.
---
**Further reading**
- [Using Monte Carlo Simulations to Predict Delivery Timelines](https://agileseekers.com/blog/using-monte-carlo-simulations-to-predict-delivery-timelines): Agile Seekers
- [Forecasting software project completion dates through Monte Carlo simulation](https://towardsdatascience.com/forecasting-software-projects-completion-date-through-monte-carlo-simulation-c1baa5bcf976): Towards Data Science
- [Probabilistic forecasting in agile](https://us.agiledigest.com/probabilistic-forecasting-in-agile/): Agile Digest
- [Planning fallacy](https://en.wikipedia.org/wiki/Planning_fallacy): Wikipedia (good summary of the research lineage from Kahneman/Tversky forward)
---
### Your AI coding assistant can now tag commits to GoalPath items
*Published: 2026-05-05*
## The PR no one remembers
You merge a PR on Friday afternoon. Monday morning, someone in the team chat asks "did the auth redirect fix go out last week?" You scroll through the merged PRs, click into the right one, copy the commit subject into the GoalPath item comment, paste a link, hit send. Five minutes gone, twice a week, every developer on the team.
This is the kind of small ritual that nobody notices is expensive until you add it up. Two minutes here, three minutes there. Multiply by every item, every week, every team. The gap between "the work shipped" and "the activity timeline knows the work shipped" is where status updates go to die.
GoalPath has had a GitHub commit linking integration since April. Tag a commit with `#GP-47` (or `#GP47`, both work, case insensitive) and the integration files it under that item's activity timeline within seconds. Branch names like `feature/GP-47-auth-redirect` work too. PR titles work too. The plumbing has been there for weeks.
But the link rate has been embarrassingly low. The reason was simple: the AI coding assistants writing most of those commits had no idea the convention existed.
This week we shipped four small updates that close that gap. None of them changed the parser or the integration itself. All of them changed where the convention is documented so AI assistants actually see it.
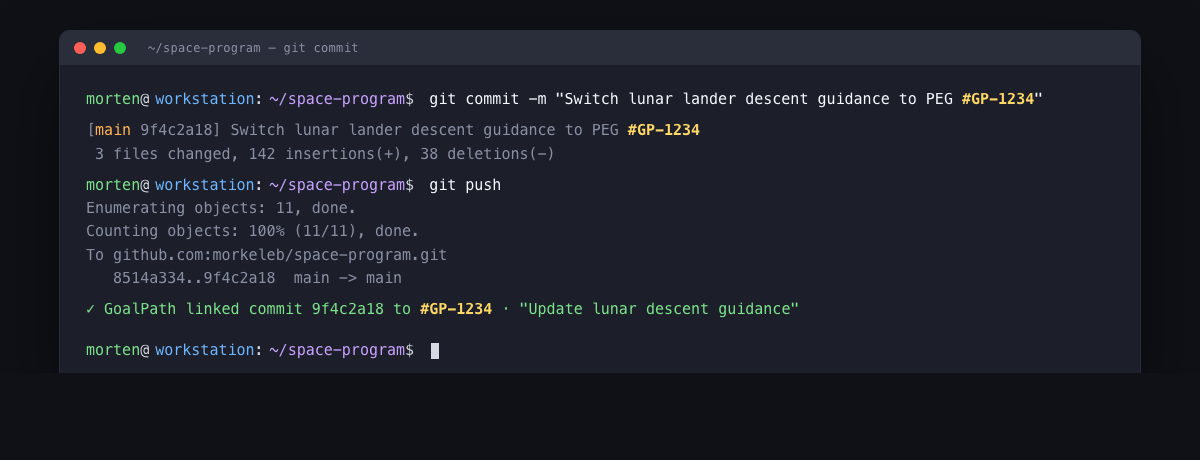
## What changed
Four things, none of them dramatic on their own. Together they make the AI assistant a useful collaborator instead of a forgetful one.
**The CLI gained enum schemas on its MCP tools.** When your AI assistant calls a GoalPath tool through the Model Context Protocol, it now gets a clear, immediate error if it tries to set an item to "Done" instead of "Finished", or types "blocked" instead of "Blocked". Before, the call sailed through validation and failed somewhere downstream with a less actionable message. The valid values are now part of the schema the AI sees, so most typos never happen in the first place.
**The CLI surfaces the item's short number in MCP responses.** When the AI creates an item, lists items, or searches items, the response now includes the `#GP-N` short number directly. Before, the AI had to call `get_item` after creating something just to read the number. One less round trip, and the number is right there next to the title where the AI is already looking.
**The `goalpath mcp init` command grew an instruction file flow.** Run `goalpath mcp init` in any project and it now detects whether you have a `CLAUDE.md`, `AGENTS.md`, `.cursorrules`, or `.github/copilot-instructions.md`. If you do, it offers to append a small section explaining the `#GP-N` commit tagging convention. The block is wrapped in HTML comment markers so re-running the command updates it in place. No duplication, no clobbering your content.
**The skills plugin got a version bump.** The `goalpath-skills` plugin had been teaching the convention since April, but the version field never moved past 1.0.0. The plugin loader caches by version, so installed copies never refreshed. Bumping to 1.0.1 forces every installed copy to pull the current content the next time the user reinstalls. A small fix with outsized consequences for everyone running the skills today.
## How to update
If you are running the GoalPath CLI locally as your MCP server (`goalpath mcp serve` is in your `.mcp.json`), pull the latest:
```bash
npm install -g @goalpath/cli@latest
```
The new version is `1.1.0`. Restart your AI assistant after installing so the tool schemas are reloaded.
For the skills plugin in Claude Code:
```
/plugin update goalpath-skills
```
Or reinstall it from the marketplace. The version you want is `1.0.1` or newer.
If you already have a project with an instruction file (`CLAUDE.md`, `AGENTS.md`, `.cursorrules`, or `.github/copilot-instructions.md`), this is a good time to run:
```bash
cd /path/to/your/project
goalpath mcp init
```
It will detect the file and offer to append the `#GP-N` section. Pick yes, commit the change, and every developer (and every AI assistant) on the team gets the convention for free.
## Why this matters
The deeper point is not really about commit linking. It is about what an AI coding assistant needs to be a useful collaborator on a real product team.
Without context, an AI is a confident stranger. It writes code that compiles, but it has no idea which item the code belongs to, which status transitions are valid, or whether the change you just asked for is the highest priority work today. So the human has to be the bridge: paste an item ID into the prompt, copy the AI's output back into the GoalPath comment, manually update the status. The AI is helpful in narrow ways, but the team's process still runs on a parallel track in the human's head.
The MCP server changes that. The AI gets direct, scoped access to GoalPath through proper auth boundaries. It can read what you are working on, write status updates, post comments with PR links, and now tag the commits it writes so the activity timeline reflects what actually shipped. The team's process becomes the AI's process, not the human's.
The skills package the workflow on top of that. `/goalpath-discover` turns a half-formed idea into a written PRD. `/goalpath-plan` breaks that PRD into items with estimates. `/goalpath-implement` ships the entire milestone on a single branch with one PR. `/goalpath-work` drives a single item from start to finish. `/goalpath-status` tells you what is on your plate right now and what to pick up next. The slash commands are short, the structure is consistent, and the AI follows the same path every time.
This is the pattern across every GoalPath integration. The Chrome extension captures bugs from the browser. The VS Code extension puts your task list in the editor sidebar. The CLI runs the MCP server locally so your AI assistant has direct access. The link rate today sits around 2.5 percent, and it should climb steadily now that the convention reaches every AI client through the channels they actually read. We will know it is working when "did that ship?" stops appearing in the team chat.
## Try it
Update both packages, run `goalpath mcp init` in your project, and watch your next AI-written commit show up under the right item without anyone copying anything anywhere.
[Install the GoalPath CLI](https://www.npmjs.com/package/@goalpath/cli) | [Browse the goalpath-skills plugin](https://github.com/morkeleb/goalpath-skills) | [Read the integration docs](https://goalpath.app/docs)
---
### The real cost of context switching across milestones
*Published: 2026-04-30*
## The meeting nobody talks about
Here is a situation that happens in a lot of product teams. It is usually a planning call or a sprint review. Someone asks "how is Milestone B going?" and the honest answer is: slowly. Not because the work is hard, not because the team is lazy, but because the same three people who are supposed to deliver Milestone B are also halfway through Milestone A, triaging bugs in Milestone C, and supporting a customer escalation that technically lives in Milestone D.
The work is real. The effort is real. But the milestones are not moving.
Most teams reach for explanations that are more comfortable. The estimates were off. There was unexpected complexity. We had some unplanned work. All of those things may be true. But underneath them, almost always, is a simpler problem: too many milestones running at the same time, with the same people assigned to all of them.
Gerald Weinberg put numbers on this in Quality Software Management. His table is not uniform: two projects means roughly 20% overhead, three projects means 40% total overhead, and five projects leaves you under 25% effective. Each additional project adds more than the last, because switching cost is not linear. DORA research has consistently found that organizational instability, including shifting priorities, correlates with lower performance and higher burnout. It is the same mechanism, viewed at a team level instead of an individual one.
GoalPath applies penalties derived from Lean research on concurrent work streams. The thresholds are calibrated per person, based on how many milestones each individual is actively working across at once:
- **1 milestone**: No penalty. Full velocity.
- **2–3 milestones**: 15% penalty. Manageable, but real.
- **4–7 milestones**: 30% penalty. Significant throughput loss.
- **8+ milestones**: 50% penalty. Half effective capacity gone.
These feed directly into each person's contribution to the forecast. The more milestones a person juggles, the less of their capacity counts toward any single one.
## Why teams almost never see this
The problem with context switching is that it is invisible in most tracking tools. Your Jira board shows items moving through columns. Your burndown chart slopes downward. Everyone is busy. Nothing is obviously wrong.
What you do not see is the *effective* velocity. The number of story points your team could deliver if they were focused, versus what they actually deliver when they are split across five active milestones.
Most teams learn about their multitasking penalty at the end of a quarter, when they look back and realise three milestones they planned to finish are sitting at 60%, 70%, and 80% done. Each one almost there. None of them shipped. The Friday status email goes out, and someone writes "good progress across the board." Good progress. Nothing delivered.
That is what the 15–30% penalty looks like in practice. Not a dramatic crash, just a steady erosion of throughput that never shows up until you zoom out.
## What GoalPath sees that your status email cannot
GoalPath tracks which milestones each team member is currently active on. Not historically, right now. It looks at in-progress items, finds which milestones each person is actively working across, and calculates a multitasking penalty for each person based on their concurrent milestone count.
That penalty feeds directly into the forecast.
When you open the Duration Forecast panel on a milestone, you will see a "Velocity Impact" section if GoalPath has detected multitasking. It shows the penalty percentage and labels it clearly: "Team velocity reduced due to parallel work streams." The effective velocity shown in the calculation breakdown is the number the forecast is actually built on, already adjusted downward.

Most forecasting tools (spreadsheets, rough estimates, gut feel) assume the team is fully focused on the milestone being projected. They use the raw velocity, the number from when things were going well. GoalPath uses the effective velocity: what the team can actually produce right now, given the number of tracks they are juggling. The two numbers are often far apart.
## The Coordination Impact card
The Velocity Analytics page has a card called "Coordination Impact." It appears only when GoalPath detects a project-wide multitasking penalty, meaning enough team members are spread across enough milestones that it is affecting aggregate throughput.
It shows a single percentage: the share of velocity being lost to coordination overhead. Not a theoretical estimate. A calculation from the current state of the project.

When this number is high, the right question is not "how do we go faster?" It is "what can we stop doing simultaneously?"
## The ritual it replaces
Most teams learn about their multitasking problem through a retrospective. Something slipped, someone asks why, a senior engineer explains that they have been pulled in six directions. The team agrees to "be more focused." Two weeks later, the planning meeting adds two more parallel tracks because a stakeholder wanted two things.
The retrospective is the replaced ritual. The value is not in the conversation after the slip. It is in seeing the penalty before the commitment is made.
When you are looking at a milestone forecast in GoalPath and you see the effective velocity is 30% lower than the raw velocity because three of the five people assigned to this milestone are also active on two others, you have the data you need before the planning meeting. Not after the quarter ends.
That is the mechanism: guided workflow produces per-person WIP data across milestones, the velocity service applies empirically derived penalties, and the forecast reflects what will actually be delivered. Not what could be delivered in a world where everyone is fully focused.
## When running parallel tracks makes sense
Not all parallel work is waste. There are real situations where multiple milestones should be in flight at the same time:
**Different teams, different tracks.** If your frontend team is building the UI for Milestone B while your backend team finishes Milestone A's API, that is not multitasking. That is parallel specialization with low switching overhead. GoalPath's team-based velocity calculations handle this correctly, tracking velocity per team rather than blending everyone together.
**Dependencies with wait time.** If Milestone A is blocked on an external dependency for two weeks, it makes sense to start Milestone B rather than idle. The key is that people are not actively working both at the same time.
**Short, unrelated bursts.** Incident response, a critical bug, a compliance deadline: sometimes two things genuinely have to happen. These are real, and pretending otherwise just means making promises you cannot keep.
The problem GoalPath is designed to detect is not "two things in flight." It is "six things in flight, with the same core engineers on all of them, and forecasts that do not know it."
## A practical check you can do right now
Open your project in GoalPath. Go to Velocity Analytics. If you see a Coordination Impact number above 15%, you have a multitasking problem worth addressing.
Then open the milestone you are most worried about, the one with the nearest deadline or the most stakeholder attention. Expand the "Calculation Details" section in the forecast panel. Look at the raw velocity versus the effective velocity. The gap is the cost of context switching, expressed in points per week.
If the gap is large, you have two options. One is to accept the forecast as-is and negotiate scope or timeline. The other is to reduce active milestones, either by finishing one before starting another, or by moving people off tracks they do not need to be on right now.
GoalPath does not make that decision for you. But it makes the cost visible, in the same place where you are already looking at delivery dates, before you commit to something that the data says you cannot deliver.
That is what most teams are missing. Not the knowledge that context switching is bad. Everyone has heard that. What they are missing is a number, attached to their actual team, for the milestone they are actually planning, visible before the promise is made.
---
**Further reading**
- Gerald Weinberg's multitasking overhead table: [Coding Horror: The Multi-Tasking Myth](https://blog.codinghorror.com/the-multi-tasking-myth/)
- The 2024 DORA report on organizational stability and productivity: [dora.dev/research/2024](https://dora.dev/research/2024/dora-report/)
- SEI on context switching in DevOps environments: [SEI Blog: Addressing the Detrimental Effects of Context Switching with DevOps](https://www.sei.cmu.edu/blog/addressing-the-detrimental-effects-of-context-switching-with-devops/)
- Research on task switching and software development: [ResearchGate: Impact of task switching and work interruptions on software development processes](https://www.researchgate.net/publication/317989659_Impact_of_task_switching_and_work_interruptions_on_software_development_processes)
---
### What makes delivery predictable (and what breaks it)
*Published: 2026-04-23*
## The question nobody wants to answer
Someone asks when the milestone will ship. You have a feeling. You have a spreadsheet. You have last sprint's velocity and a rough point count. You do the math in your head, add a mental buffer because things always take longer, and give a date.
Three weeks later the date is wrong.
Not wrong because your team stopped working. Wrong because the math was always hiding something, and now that something showed up as an unplanned incident, a scope addition, a dependent milestone that wasn't as done as it looked, or just natural velocity variance that hit in the wrong direction.
Some teams are good at this. They give dates and they land within a week of them, consistently. Most teams are not. The question is what separates them.
## What actually drives predictability
There are four signals that show up repeatedly in teams that forecast reliably. None of them are surprising in isolation. What's surprising is how rarely teams measure all four at once.
**Consistent velocity.** Not high velocity. Consistent. A team that delivers 9-11 points every week is much easier to forecast than one that delivers 5 one week and 18 the next. DORA research and flow framework literature both point to stability as a stronger predictor of on-time delivery than raw throughput. When velocity swings wildly, any forecast built on the average is likely to miss. The question to ask is not "what's our average velocity?" but "what's the variance around that average?" High variance is the forecast killer.
**Low WIP variance.** Teams that limit work in progress tightly have two advantages. First, individual items move faster because there's less multitasking tax. Second, and more relevant to forecasting, the number of items in flight stays predictable. When WIP is high and variable, you get unpredictable queue buildup. Little's Law makes this precise: lead time equals WIP divided by throughput. Double the WIP without increasing throughput and you've doubled your lead time. Limit WIP and lead time stabilizes. Stabilize lead time and forecasting gets dramatically easier.
**Estimated backlogs.** This one sounds obvious. It's not. Many teams estimate the items they're about to start and leave the rest rough. That works for sprint planning but it destroys milestone-level forecasting. If 40% of your milestone's items are unestimated, any forecast of the whole milestone has a giant unknown built into it. The forecast might look precise, but it isn't. The confidence interval should be wide enough to drive a truck through.
**Fewer parallel tracks.** Context switching degrades velocity in a fairly well-documented way. When team members split attention across multiple active milestones, each track moves slower than it would if the team was focused. This compounds the forecasting problem: more parallel tracks means more variance in which track gets attention in any given week, which means more variance in individual milestone progress, which means wider forecast ranges for everything.
These four signals are connected. Teams that limit WIP naturally have fewer parallel tracks. Teams with estimated backlogs can catch unestimated items before they become forecast surprises. Teams with consistent velocity have usually already solved the WIP and parallel work problems that cause variance.
## The ritual that produces false confidence
When someone asks "when will this ship?" the typical answer is the spreadsheet forecast. A PM, tech lead, or founder opens a Google Sheet or a Jira report, looks at remaining work, estimates it roughly, divides by something like average velocity, adds a buffer, and sends a date. This takes maybe ten minutes and produces a number that looks precise.
The problem isn't the ten minutes. The problem is that this answer doesn't surface what it doesn't know.
It doesn't account for velocity variance. If your team's weekly output swings by ±40%, a point-estimate forecast will be wrong. It doesn't account for unestimated items, which add invisible mass to the milestone. It doesn't account for parallel work stealing capacity. And it doesn't propagate uncertainty through dependencies: if this milestone depends on another one that's also being estimated the same way, the error compounds.
A single date with no confidence interval is worse than no forecast at all, because it creates false confidence. Stakeholders anchor to it. The PM feels committed to it. And then reality diverges from the spreadsheet.
## How GoalPath reads these signals automatically
GoalPath tracks all four predictability signals continuously, so you're not doing the Friday afternoon calculation from memory.
**Velocity trend analysis.** The velocity page shows weekly throughput over the rolling six-week window, with standard deviation surfaced alongside the average. You can see immediately whether your team is stable or swinging. A tight cluster of weekly bars means high-confidence forecasts. A scattered one means wide ranges are warranted.

**Three-point forecasting.** Every milestone forecast shows three numbers, not one: optimistic, most likely, and pessimistic completion dates. These aren't guesses. They're derived from actual velocity variance using a straightforward calculation: mean velocity plus or minus one standard deviation. It's not a Monte Carlo simulation. It's a direct translation of how consistently your team has delivered. A team that's delivered 9-11 points per week for six weeks gets a tighter range than a team that swings 5 to 18. The range is earned by consistency, or widened by variance.

**Confidence levels.** Each forecast carries an explicit confidence level (high, medium, or low), and what you get depends on both velocity consistency and how the forecast is calculated. Teams with their own dedicated velocity data and low variance (standard deviation below 50% of average velocity) get High confidence. Projects where GoalPath falls back to global or cross-team velocity data get Medium or Low depending on variance. When there isn't enough data at all (for example, a new team that hasn't yet built a velocity history), GoalPath falls back to historical averages or industry defaults, and the forecast will say so. Don't expect tight ranges from day one; the forecast gets more accurate as your delivery data accumulates. When you're looking at a forecast and it says "Low confidence," that's the system telling you the three-point range is real and wide. GoalPath surfaces this rather than hiding it.
**Uncertainty propagation through dependencies.** This is the part that catches most teams off guard. GoalPath schedules milestones sequentially within each team, ordered by priority. If earlier milestones have wide forecast ranges, later milestones inherit that uncertainty. A milestone can't start until the ones ahead of it finish. GoalPath shows the expected start date for a milestone including the cumulative slip potential of its predecessors. If the milestones before this one have wide confidence ranges, the start date range for this milestone reflects that honestly.
**Unestimated item warnings.** When items in a milestone haven't been estimated, GoalPath surfaces the count in the forecast panel with an explicit note that accuracy is reduced. This turns an invisible problem into a visible one. The fix is simple: estimate those items. But until you do, you see the forecast for what it is: partially informed.
**Multitasking penalties.** When your team is actively working across multiple milestones simultaneously, GoalPath applies a velocity reduction to each. Running two to three concurrent milestones applies a 15% capacity penalty. Running four to seven applies 30%. Running eight or more applies 50%. These tiers are based on the documented cost of context switching on effective throughput. There's also a separate velocity-division effect: team velocity is split across the number of milestones currently in progress, so each active track is effectively working with a fraction of total team capacity. The forecast you see already accounts for both of these parallel-work costs.
## What changes when you look at this regularly
The forecast panel in GoalPath isn't just for when a stakeholder asks "when will this ship?" It's meant to be a regular part of planning and prioritization.
When you open a milestone and see a low confidence forecast with a three-week spread between optimistic and pessimistic, that's a signal to do something: estimate the unestimated items, split parallel tracks, address velocity instability. The forecast shows you the problem before it becomes a missed date.
When the forecast shifts (say, optimistic slips by a week after new items get added to the milestone), the change in the forecast is itself informative. GoalPath's progress reports include forecast deltas: "this milestone moved from May 12 to May 19 this week." That's the kind of early signal that lets stakeholders recalibrate before the date becomes a crisis.
This replaces the "where are we?" ping. Not because GoalPath automatically sends that email for you (though it does generate the weekly progress report draft), but because when stakeholders have a live, calibrated forecast instead of a stale spreadsheet date, the question answers itself.
## The confidence you can give stakeholders
What separates teams that forecast reliably from those that don't is the quality of the underlying execution data, not the sophistication of their tools.
Teams that can say "we'll ship between April 28 and May 14, with the most likely date around May 5, at medium confidence" are giving stakeholders something real. Teams that say "probably mid-May" are guessing out loud. Both are estimates, but one has math behind it and the other has vibes.
GoalPath's forecast engine is built on six weeks of actual delivery data, standard deviation of your real velocity, explicit accounting for unestimated scope, multitasking cost, and dependency uncertainty. The forecast is as good as your execution data, and it tells you what would make it better.
That's the point. Not a better spreadsheet. A system that shows you the signals that drive predictability, in real time, so you can act on them before they become missed dates.
## Further reading
- [DORA metrics and software delivery performance](https://dora.dev/guides/dora-metrics/): the research foundation for measuring delivery performance
- Little's Law and WIP limits: the math behind why WIP reduction improves lead time predictability (search for "Little's Law Kanban" for many solid explanations)
- [Objectively measuring predictability](https://medium.com/asos-techblog/objectively-measuring-predictability-469c654fdbcb): ASOS Engineering on how they quantify forecast accuracy
- [Delivery metrics to improve predictability](https://plandek.com/blog/improve-your-predictability/): Plandek on the metrics that signal whether predictability is improving
---
### Flow efficiency: why your team is working but not shipping
*Published: 2026-04-16*
Your team finishes the sprint. People look tired. The board is full of started items. When you ask what shipped, you get a list of things that are "almost done."
Almost done is not shipped.
If this sounds familiar, it's probably not a people problem. It's a flow problem. And the fix is not working harder or adding more people. It is finding where work stops moving.
## What flow efficiency actually measures
Flow efficiency is a simple ratio: how much of an item's total lead time was spent with someone actively working on it, versus sitting in a queue waiting.
If a feature takes ten days from when it's created to when it ships, but people only worked on it for two of those days, your flow efficiency is 20%. The other eight days it was waiting. Waiting for a code review that didn't come. Waiting for a decision that never got made. Waiting for a dependency to unblock. Just sitting there.
Most software teams land between 15 and 25% flow efficiency. That's the industry benchmark, and it means 75-85% of the total time your work spends in your system, it's not moving. It's just waiting.
This is not a new observation. It comes from lean manufacturing, where teams measured how much of a part's total factory time was actually being processed versus sitting in a pile. The finding in manufacturing was the same: most of the time is wait time. Software is identical.
## Why utilisation makes it worse
The instinctive response to slow delivery is to push people harder. Make sure everyone is busy. No idle engineers. Full calendars.
This makes flow efficiency worse.
When people are fully utilised, queues form. Think about a busy toll booth. The toll booth is at 100% utilisation. Every car is waiting in line. The queue grows because there's no slack to absorb variation. The moment you add one more car than the booth can handle, wait time spikes.
Software teams work the same way. When engineers are fully loaded, code reviews wait. Pull requests pile up. Decisions wait because the right person is context-switching between five things. Every queue you add to a fully-loaded system increases lead time.
Queuing theory has a name for this: the last 20% of utilisation causes a disproportionate increase in wait time. A team at 80% utilisation moves noticeably faster than a team at 95%, not because of 15% more capacity, but because at 80% there's enough slack that things don't pile up.
Measuring utilisation, making sure everyone looks busy, is exactly the wrong metric to optimise for.
## How to tell if waiting time is your problem
You need to look at a few specific things.
First, look at lead time versus cycle time. Lead time is the total elapsed time from creation to delivery. Cycle time is the time from when someone started working on it to when it shipped. If your median lead time is 12 days but median cycle time is 3 days, 9 days of every item's journey is waiting. That's a 25% flow efficiency, which is average, but it tells you clearly that reducing wait time by half would cut your lead time by more than waiting-time reduction alone.
Second, look at which items are aging. Not all wait time is the same. Some items wait two days in a review queue. Some items sit started for three weeks. The ones sitting for three weeks are your flow blockers. Those are the ones where something is structurally wrong: no owner, unclear requirements, a dependency that nobody is chasing, a decision that hasn't been made.
Third, count how many items are in flight at once. If your four-person team has 18 items started, flow efficiency is going to be terrible. Not because people aren't working, but because the context-switching cost alone means nothing gets continuous attention. Work moves in bursts, waits in between, and lead times balloon.
## The "alignment sync" is a symptom
Most teams respond to slow delivery by adding meetings. A weekly sync to check on blockers. A bi-weekly planning meeting to reprioritise. A quick alignment call to make sure everyone knows what's important.
These meetings are a symptom of invisible work. When you can't see where work is stuck, you schedule a meeting to find out. The meeting itself adds to wait time, because work is waiting for the outcome of the meeting before it can move.
The weekly status email is the same problem. You spend Friday compiling a report of what's stuck and what's moving, because without a system that surfaces this automatically, people don't know. And by Monday, the report is already out of date.
The replaced ritual is the meeting-to-find-out-where-things-are-stuck. Not the standup, not architecture decisions. The specific meeting where someone asks "what's blocking us?" and nobody has a good answer until everyone has spoken.
## What GoalPath shows you
GoalPath calculates flow efficiency automatically from how your items move through the workflow. When you look at the Velocity Analytics page, you see four metrics side by side: Flow Time, Flow Efficiency, Flow Distribution, and Flow Load.

The Flow Efficiency card shows your efficiency percentage with a benchmark label. Below average (under 15%), Average (15-25%), Above average (25-40%), or Excellent (above 40%). You know immediately whether your waiting time is typical or a real problem to fix.
But the number alone doesn't tell you where to look. The Flow Load section does that.
GoalPath buckets every in-progress item by how long it's been started: fresh (3 days or under), normal (4-7 days), aging (8-14 days), stale (15-30 days), and stuck (over 30 days). The Flow Load card shows your total WIP count, how many items are stale or stuck, and a summary badge.
If you have seven items in the "stuck" bucket, those are not delivery problems. They're decision problems, dependency problems, or ownership problems. Each one is adding wait time to your lead time without any active work happening.
GoalPath records when items are created, when they're started, and when they're completed. That's all the data it needs to calculate flow efficiency and aging automatically. You don't report into it. You just work, and the insight comes from the workflow data.
## Where work actually gets stuck
Once you can see aging items by milestone, a pattern usually emerges. Work tends to stack up in one or two specific places:
**Review queues.** Items waiting for someone to review or approve them. This shows up as a cluster of aging items with no clear next owner. The fix is usually to make ownership explicit: someone specific is responsible for moving this item, not "whoever has time."
**Decision dependencies.** Items that are started but can't proceed until a decision is made elsewhere. These are easy to miss because they look like normal WIP. The fix is to make blocked items visible. Set the Blocked highlight in GoalPath so the team knows this isn't just slow, it's waiting on something external.
**Milestone overload.** One milestone has twelve items in progress because it's where everything important lives. Flow efficiency for that milestone will be terrible. The fix is WIP limits: not twelve things in flight, but three, with the rest explicitly queued.
**Unclear requirements.** Items that are "started" but the developer is waiting for clarity. Often nobody has marked them blocked because it feels like their fault for not knowing the answer. These show up as stale items where the last activity was weeks ago.
The GoalPath Insights engine can diagnose this for you. Ask it "Where is work getting stuck?" and it will look at your flow metrics, your current WIP, your aging distribution, and your velocity data, and give you a specific answer grounded in your project's actual data, not generic advice, but a diagnosis tied to what's actually happening in your workflow.

## What to do about it
The specific fix depends on where the bottleneck is, but the pattern is the same in most teams.
Start by finding your stuck items. In GoalPath, sort your in-progress items by age. Look at anything that's been started for more than two weeks without moving. For each one, ask: what needs to happen for this to move? If there's an answer, make it explicit. Assign an owner. Set a Blocked highlight if it's waiting on something external. If there's no good answer for why it's started, consider moving it back to not-started. The started status should mean "actively being worked on", not "we plan to work on this eventually."
Then look at WIP. If your flow load card shows 18 items in progress for a four-person team, you need to finish before you start. That's the core discipline. Not as a rule for its own sake, but because each additional started item adds queue time to everything else.
Finally, check the milestone distribution. If one milestone is carrying most of the in-progress items, look at whether those items are genuinely active or just parked there. Milestones become catch-all buckets when there's no forcing function to finish things before adding new ones.
## Improving flow efficiency is mostly about removing friction
You don't improve flow efficiency by working faster. You improve it by removing the things that make work wait.
Code reviews that sit for three days are not a reviewer productivity problem. They're a queue problem. The reviewer is fully loaded. Adding a norm of "reviews within 24 hours" without changing anything else just adds stress without changing the queue dynamics.
What changes the queue is smaller WIP. When people have fewer things in flight, they have more capacity to respond when something needs attention. The review queue gets reviewed faster not because reviewers are working harder, but because they have the bandwidth to see it.
Most teams that improve their flow efficiency do it by finding the two or three specific places where work consistently piles up, and doing something structural about each one. Not a process improvement initiative. Just: this keeps getting stuck here, what can we change to stop that?
GoalPath tells you where those places are. The rest is a conversation about what to do about them.
## Further reading
- [Flow Efficiency: A great metric you probably aren't using](https://resources.kanban.university/flow-efficiency-a-great-metric-you-probably-arent-using/): Kanban University's explanation of the metric and why most teams ignore it
- [Our survey says: uncovering the real numbers behind flow efficiency](https://medium.com/asos-techblog/our-survey-says-uncovering-the-real-numbers-behind-flow-efficiency-e54f136b1fab): ASOS Tech Blog survey of 63 teams and their actual flow efficiency numbers
- [Flow & Queueing Theory](https://less.works/less/principles/queueing_theory): LeSS framework explanation of why high utilisation creates queues
---
### Planned vs unplanned work: what the ratio tells you
*Published: 2026-04-09*
## When the sprint ends and nobody quite knows what happened
You planned the sprint. Everyone had their work lined up. Then a customer escalated. Then someone found a bug in production. Then a stakeholder pinged about "just one small thing." By Friday, half the planned work is still in progress, and the team is defending why they didn't hit the milestone.
This is not a planning failure. It's a ratio problem.
If you have been in software for a while, you know this pattern. The plan looks solid on Monday morning. By Wednesday, real life has started editing it. By Friday, the original plan and the actual work barely resemble each other. The frustrating part isn't that things changed. It's that the changes weren't tracked, so nobody can tell whether the team underperformed or whether the plan was hijacked.
Telling the two apart is what makes it possible to fix the right thing.
## Unplanned work is not the enemy
Most articles about scope creep get this wrong. Unplanned work isn't always bad. If a production outage hits, you want your team to respond. If a customer surfaces a blocking bug the day before their contract renewal, you handle it. A team that ignores all unplanned work because "it wasn't in the sprint" is a team that's optimizing a process at the expense of outcomes.
The goal isn't zero unplanned work. The goal is knowing what the ratio is, and making a conscious call about what that ratio should be.
Most teams never measure it. They just experience it. The sprint ends. Things slipped. There's a vague feeling that "a lot of stuff came up." Then the cycle repeats.
A team consistently running 10-15% unplanned work is probably healthy. Responsive, but not chaotic. A team running 40% is reactive. Work is arriving faster than it can be absorbed, forecasts are meaningless, and the planned roadmap is a fiction that gets politely ignored. The 2024 DORA research found that unstable organizational priorities are among the strongest predictors of developer burnout. Chronic high unplanned work is exactly that kind of instability, just at the sprint level.
## What your planning ritual is actually telling you
Most teams handle unplanned work through conversations. Someone raises something in standup. It gets added to the board. Sprint planning gets "adjusted." The velocity numbers at the end of the sprint don't reflect the interruptions, so the forecasts keep being wrong in the same direction, week after week.
The ritual this replaces is the informal scope-change conversation. The "can we just add this in?" moment that happens in Slack, in the hallway, in standup. Nothing wrong with those conversations. The problem is that without a structured intake, they're invisible to everyone except the people in that channel at that moment.
When you have no structured triage, you have no data. And without data, the conversation about what the right ratio is never happens. The team is always reacting, never calibrating.
## What GoalPath tracks and why it matters
GoalPath detects unplanned work automatically through two distinct mechanisms.
The first is automatic scope detection. Any item added to a milestone that is already in progress gets flagged automatically. No manual tagging required. The moment someone adds a bug fix or a new task to a running milestone, GoalPath marks it as unplanned.
That flag shows up in a few places.
**On the item itself:** an orange "Unplanned" badge appears next to the status. Anyone opening the item can see immediately that this wasn't part of the original plan. The tooltip explains: "This item was added after the milestone started. It contributes to scope creep and may impact forecast accuracy."
The second mechanism is the **triage inbox**, a separate intake queue for work that arrives without a home. Items without an assigned milestone, or new requests that haven't been prioritized yet, land here. The inbox is GoalPath's structured alternative to ad-hoc Slack conversations. Each item can be assigned a triage priority: Incident (drop everything), Expedite (next in queue), Standard (work it in normally), or Deferred (acknowledge it, park it for later).
These are distinct mechanisms: the automatic scope detection tracks items added after a milestone started, while the triage inbox handles the intake flow before items are placed anywhere. Together, they give unplanned requests a visible home and a deliberate process, rather than a hallway conversation that only a few people heard.

**In the velocity analytics:** GoalPath tracks your unplanned work ratio week by week across the project. Not just this sprint, but the trend over 12 weeks. You can see whether your ratio is creeping up, stabilizing, or improving. You can filter by team to see if the interruptions are distributed evenly or hitting one team harder.
The velocity chart itself shows the split visually. Orange bars are planned work, blue bars are unplanned. When the blue starts growing relative to the orange, you can see the interruption pattern forming before it shows up in a missed forecast.
## The flow distribution view tells a different story
There's another angle that's easy to miss. The flow distribution chart in GoalPath's insights view shows your completed work broken down by type: Features, Bugs, and Tasks, tracked week by week.
If your bugs column is quietly growing, that's often a sign of reactive work accumulating. Features require planning. Bugs arrive. A healthy product team in a growth phase should be heavy on features. A team maintaining a legacy system might legitimately run 50% bugs. But if you're supposed to be building a new product and your distribution is quietly shifting to 60% bugs and 40% features, that's the data telling you something about where the interruptions are actually coming from.
Flow distribution doesn't just show what you shipped. It shows whether the thing you're building matches the thing you planned to build.

## How forecasts absorb the data
The unplanned work data feeds directly into delivery forecasts, not just dashboards. GoalPath uses your historical unplanned work ratio to automatically adjust delivery forecasts.
If your last ten completed milestones averaged 20% unplanned work, GoalPath applies a 1.2x multiplier to future duration estimates. That 10-week milestone is probably a 12-week milestone when you account for the interruptions that will arrive. The adjustment is weighted toward recent milestones, so if your team has been getting better at triage, the forecast improves accordingly.
You're not just looking at the number after the fact. The number feeds forward into the forecast so stakeholders see realistic timelines, not optimistic ones.
Most teams don't have this. They have a sprint board and a gut feeling. GoalPath has the data from your last ten milestones, weighted by recency, baked into the next delivery estimate.
## A simple way to read your own ratio
If you start tracking unplanned work today, here's a rough frame for what you're seeing. These are rules of thumb, not benchmarks from a study. Treat them as a starting point for your own calibration.
Under 15% is generally healthy. Some responsiveness is normal and good. Your planned work is mostly protected.
15–30% is worth watching. You're not in crisis, but unplanned work is taking a meaningful bite out of capacity. Worth a conversation about whether the triage process is working correctly. Are expedites being over-used? Are incidents being handled with the right level of urgency?
Above 30% consistently means the planning is probably not trustworthy. Stakeholders sense this even if they can't name it, which is often why they start asking "where are we?" multiple times a week. The forecast they were given doesn't match what they're observing. The fix isn't better planning. It's tightening the intake process, being more deliberate about what gets expedited, and surfacing the ratio explicitly in alignment meetings.
GoalPath's alignment meeting flow includes a flow health stage that surfaces active blockers, WIP limit warnings, unresolved escalations, and at-risk or stale milestones. These are the things most likely to derail the plan before the team even touches new priorities. The unplanned work ratio and flow distribution live on the Velocity Analytics page, and the alignment meeting is a natural moment to bring that data into the room before any new priorities are set. That conversation used to happen informally, in different places, with different people having different information. The alignment meeting makes it a standing ritual with the actual numbers in front of everyone.
## The question the ratio answers
The question teams always struggle with is: are we slow, or were we just interrupted a lot?
Without the data, you can't answer it. The standup after a rough sprint usually produces a mix of vague explanations and defensive justifications. Everyone knows things went sideways. Nobody can say why with any precision.
With the unplanned work ratio, you can answer it in one number. If the ratio was 35% this sprint, the team wasn't slow. A third of their capacity was consumed by work that arrived after the plan was set. That's a different conversation than "we underestimated" or "people weren't focused."
It also tells you what to work on. If the ratio is high because of bugs, you have a quality problem. If it's high because of customer escalations, you have an expectation management problem. If it's high because stakeholders keep adding things mid-sprint, you have a prioritization governance problem.
The number points at the root cause. From there, you can actually fix something.
## Further reading
- [2024 DORA State of DevOps Report](https://dora.dev/research/2024/dora-report/): burnout research and organizational stability findings
- [Accelerate State of DevOps 2022](https://dora.dev/research/2022/dora-report/2022-dora-accelerate-state-of-devops-report.pdf): unplanned work benchmarks and interrupt-driven work patterns
---
### Understanding cycle time: the metric that actually predicts delivery
*Published: 2026-04-02*
## Why your delivery estimates keep being wrong
Someone asks when a feature will ship. You do a quick mental calculation: sprint ends Friday, a couple items are in review, maybe next week. You say "end of next week" with reasonable confidence. Two weeks later it is still not done, and you are back in that conversation.
This is not a planning failure. It is a measurement failure. The number you gave was based on a guess dressed up as an estimate. The actual data was sitting in your project history the whole time, but nobody had surfaced it in a useful form.
There are three distinct time measurements that matter in software delivery. Most teams confuse them or use them interchangeably. Once you understand the difference, you can give stakeholders an answer that actually holds.
## Lead time, cycle time, wait time: not the same thing
**Lead time** is the total clock time from when a piece of work enters your system to when it ships. It starts when someone creates the item and ends when it is accepted. From a customer or stakeholder perspective, this is the number that matters. It answers "how long does it take to get something done around here?"
**Cycle time** is the narrower slice: the time from when your team actually starts work on an item to when it is done. The cycle time clock begins the moment someone moves it out of NotStarted (whatever that first active status is). This is the number your team can most directly influence.
**Wait time** is the remainder. Lead time minus cycle time. It is all the time an item sat in someone's queue before anyone touched it: the days it spent in the backlog, waiting for review, blocked on a dependency.
The relationship is simple: lead time = cycle time + wait time.
Why does the distinction matter? Because they have completely different causes and different fixes.
If your cycle time is high, something about how your team actually executes is slow. Too many items in progress at once, unclear requirements at the start, slow code review, complex work that was underestimated.
If your wait time is high, the work is fine once someone picks it up. It is just not getting picked up. The backlog is too deep, items sit unassigned, reviews take days because the reviewer is juggling five other things.
Most teams trying to "improve velocity" attack cycle time when their real problem is wait time, or vice versa. They run faster at the wrong part of the system. That is why separating the two is not just an academic exercise.
## The average will mislead you
Here is a trap most teams fall into: they look at average cycle time. Their average is five days, so they promise delivery in a week. Then 30% of items take twelve days, and the promise is broken.
Averages are pulled by outliers. One item that gets stuck for three weeks drags the average up, but most items finish in four days. Using the average to make promises is optimistic about the typical case and still wrong about the edge cases.
A better approach: instead of the average, look at the number that 85% of your items actually finish within. GoalPath calculates this automatically. If that number is nine days, you can tell a stakeholder that nine out of ten items will be done within nine days of starting. That is a commitment you can actually keep, because it accounts for the realistic spread of your work instead of pretending everything takes the average.
A 12-person engineering team at Siemens Health Services had an 85th-percentile cycle time of 62 days. After introducing explicit WIP limits, it dropped to 36 days, a 42% improvement with no change in team size. Measuring cycle time percentiles gave them the evidence to act on a problem they already suspected but could not quantify. ([Source: Agile Alliance case study](https://agilealliance.org/resources/experience-reports/actionable-metrics-siemens-health-services/))
## Most teams are surprised by their flow efficiency
Flow efficiency is the ratio of cycle time to lead time, expressed as a percentage. If the average lead time for your items is 10 days and the average cycle time is 2 days, your flow efficiency is 20%.
Most software teams land between 15% and 25% when they first measure this. ([Source: Kanban University](https://resources.kanban.university/flow-efficiency-a-great-metric-you-probably-arent-using/)) That means work is actively being worked on for roughly one day out of five. The other four days it is sitting in a queue somewhere.
Teams that have not measured this before tend to be surprised. They thought their process was fairly lean. The data says otherwise.
High-performing teams push this toward 40% and above. That does not mean everyone is coding all the time. Some waiting is inherent and even valuable (code review, QA). But it does mean you understand where the wait is happening and you have made a deliberate choice about it rather than having it accumulate invisibly.
## How GoalPath shows this to you
On the Velocity Analytics page, the Flow Time card shows lead time, cycle time, and wait time together, covering the last 12 weeks of completed items. It leads with the lead time median because that is what stakeholders experience. Directly below it, cycle time and wait time show you the split: where your process is healthy and where it is not.

The trend badge compares average lead time across two 12-week windows, so you know if your changes are moving things in the right direction. Next to it, the Flow Efficiency card shows your efficiency percentage with a benchmark label (below average, average, above average, or excellent) so you can calibrate against what other teams achieve.
## The ritual GoalPath replaces
Before a team has this data, cycle time conversation tends to happen one of two ways.
The first is the "where are we?" sync. A stakeholder asks for a status update, someone pulls together a rough summary based on memory, and you have a 30-minute meeting where the real answer is "probably next week, we think." This happens every time someone needs a delivery estimate. The PM becomes a real-time translator between the work and the question.
The second is the end-of-sprint retrospective number. Teams record their velocity, maybe track some story points, and call it a day. Nobody breaks down whether the time went into active work or into waiting. Nobody has a number they can quote with confidence.
GoalPath eliminates both by turning the execution data your team already produces into metrics that answer the question directly. When someone asks "when will this ship?", you open the Velocity Analytics page, check the cycle time median and trend on the Flow Time card, and give an honest number grounded in your team's actual history. No meeting. No mental arithmetic. No optimism disguised as a forecast.
The mechanism: GoalPath captures when each item is created, when work begins on it (when it moves out of NotStarted), and when it is completed (set to Accepted). Those three timestamps are all GoalPath needs to compute lead time, cycle time, and wait time. Because the workflow is structured, with teams moving items through defined statuses rather than typing status into a free-text field, the timestamps are consistent and reliable by default.
## What to do with a high wait time
If you look at your Flow Time breakdown and see that cycle time is three days but lead time is twelve days, your wait time is nine days. The team is not slow. The queue is.
The most common causes:
**Backlog depth.** Items sit unstarted for days because there are thirty items in the backlog and the team picks up new work in the order it was created rather than by priority. Fixing this means being more deliberate about what goes into the active sprint or milestone, so fewer items sit untouched.
**Slow handoffs.** An item finishes development and waits three days for QA. Or code review happens in batches on Fridays. The work is done but it has not moved. Making handoffs explicit and time-boxed (a 24-hour review SLA, for instance) attacks this directly.
**WIP accumulation.** When everyone has four or five items in progress simultaneously, everything moves slowly. Items that have already been started sit in review queues while the developer has moved on to the next thing. Reducing active WIP is often the fastest way to shrink wait time, not because people work faster, but because there is less work waiting for attention at each handoff.
GoalPath's Flow Load card shows you current WIP and aging: how many items are fresh (under 3 days), normal, aging, stale, or stuck (over 30 days). If you see a lot in the stale and stuck categories, your wait time problem has a name.
## What to do with a high cycle time
If cycle time is high but wait time is low (work gets picked up quickly but takes a long time to finish), the problem is different.
Look at item size. Large items that take two weeks each will have high cycle time almost by definition. Breaking items into smaller increments (under three days of active work) will reduce the median and tighten the distribution.
Look at rework. In GoalPath, items that fail review get set to Rejected and need to be restarted. If you see a pattern of items cycling through Rejected and back to Started, the active work time is being inflated by revision cycles. This usually points to requirements clarity at the start, not execution speed.
Look at context switching. A developer working on five items simultaneously is not doing five days of focused work on each. They are doing one day here, two days there, interrupted by a higher priority. The actual cycle time is long not because the work is hard but because the clock is running while the item waits for attention from its own owner.
The 85th percentile is the most useful number here. If the median is four days but 85% of items finish within fourteen days, you have a small number of items that are taking much longer than typical. Find the pattern in those outliers. They usually have something in common.
## Trend indicators tell you if your changes are working
One of the harder parts of process improvement is knowing whether what you changed made a difference or whether the numbers moved because of randomness.
GoalPath compares your current 12-week window to the previous 12-week window and shows whether lead time is improving, stable, or worsening, along with the percentage change. This is the trend badge on the Flow Time card.
If you reduce WIP limits and three weeks later you see the trend badge flip to "Improving 18%", that is signal. You have a number attached to the change. If it stays stable or moves to "Worsening", you have information too: either the change did not work or something else is counteracting it.
Without this comparison, teams guess at whether their process changes are working. With it, you have a 24-week view of the direction your delivery speed is moving.
## The short version
Cycle time is how long items take once your team starts them. Lead time is how long they take from creation to done. Wait time is the difference: the invisible queue time that most teams never measure.
The median cycle time is what you quote to stakeholders for a realistic delivery estimate. The 85th percentile gives you a safer number that accounts for the realistic spread of your work.
GoalPath computes all three metrics automatically from your workflow timestamps, shows you the trend, and benchmarks your flow efficiency against industry data. You do not need a separate analytics tool or a Friday afternoon ritual to produce this information. It is on the Velocity Analytics page, updated daily.
The "where are we?" ping from your stakeholder is a symptom of not having this data visible and current. Once you do, the question mostly answers itself.
## Further reading
- [ProKanban: Signalling Work-in-Progress with Cycle Time Percentiles](https://www.prokanban.org/blog/signalling-work-in-progress-with-cycle-time-percentiles): why the 85th percentile is the right number for delivery commitments
- [Scrum.org: Getting to 85 (Agile Metrics)](https://www.scrum.org/resources/blog/getting-85-agile-metrics-actionableagile-part-1): the case for percentile-based forecasting over averages
- [Kanban University: Flow Efficiency](https://resources.kanban.university/flow-efficiency-a-great-metric-you-probably-arent-using/): why 15-25% is typical and how to improve it
- [DORA 2025 Report](https://dora.dev/research/2025/dora-report/): software delivery performance benchmarks across thousands of teams
---
### Why WIP limits matter more than velocity
*Published: 2026-03-26*
Your team finishes a two-week sprint. Velocity looks fine, maybe even good. But when you ask which features actually shipped to customers, there's an awkward pause. A bunch of things are 80% done. A couple more are waiting for review. One has been "almost ready" for three weeks.
The velocity number told you nothing useful about this. It never does, until after the fact.
## What velocity actually measures
Velocity tells you how much work your team completed over some past window of time. It's useful for forecasting. It's not useful for telling you whether your team is going to have a good week, or a bad one, before it happens.
Velocity tells you how far you drove last week. WIP tells you how many cars are on the road right now. One is history, the other is a prediction of what happens next.
When your WIP is high and climbing, velocity will eventually show you the damage. But by then, you've already spent a few weeks in trouble. That's why WIP is a leading indicator and velocity is a lagging one.
## Little's Law, explained without the textbook
There's a formula called Little's Law that comes from queuing theory. You don't need the math. The principle is this:
**Lead time = WIP divided by throughput.**
If your team completes 5 items per week and has 5 things in progress, the average lead time is 1 week. If that same team starts 20 things at once while still completing 5 per week, average lead time jumps to 4 weeks. Same team. Same throughput. Four times longer to get anything done.
That's not theory. That's what happens in most teams. Items get started because they seem urgent. Nobody explicitly decides to have 20 things in progress. It just accumulates. And every item added to the pile makes every other item slower.
The counterintuitive part: finishing one thing and starting nothing new is faster, for the team's overall output, than starting two new things and having three things "almost done."
## Why "almost done" is almost worthless
There's a useful question to ask about any item that's been in progress for more than a week: what's the actual customer value of 80% done?
Usually the answer is zero. A feature that's deployed and in users' hands is worth something. A feature that's still in a branch, or waiting for a final review, or needs one more thing before it can ship, is not generating any value yet. It's inventory.
The longer things sit in "almost done" status, the more they accumulate risk too. Code that's been sitting in review for two weeks while other work has been merged is going to have conflicts. The person who wrote it has moved on mentally. The context is gone.
High WIP is how "almost done" becomes "actually never done." Things get superseded, de-prioritized, forgotten. The team was busy the whole time.
## The pattern that accelerates the problem
Without WIP discipline, the spiral goes like this.
Team has 10 things in progress. Nothing is finishing because everyone is switching contexts. A stakeholder gets impatient about feature X, which has been in progress for two weeks. Team lead adds feature X to the standup agenda. Someone else notices feature Y is also delayed. Both get attention. Two more things get started to unblock them. Now there are 14 things in progress.
At the next sprint review, velocity looks okay because the team did complete some things. But lead times are getting longer. The stakeholder still doesn't have feature X. There's another alignment meeting to "figure out what's going on."
That alignment meeting is the replaced ritual. Teams do this regularly: a Monday sync, a mid-sprint check-in, a "what's blocking us?" call. The intent is to surface problems. The problem is, by the time it surfaces in a meeting, you've already been slow for two weeks.
You need to see it while it's happening, not after.
## What GoalPath's Flow Load view shows you
GoalPath tracks WIP at two levels: milestone WIP (how many milestones are currently in progress) and item WIP (how many items are in progress). Both are visible in the Flow Load section of the Velocity Analytics page, with a per-person breakdown available in the Flow Load card.
The Flow Load card shows you total WIP right now and breaks it into aging buckets: fresh (0-3 days), normal (4-7 days), aging (8-14 days), stale (15-30 days), and stuck (over 30 days). That last bucket is the number to watch. A few "fresh" items is expected. Growing "stale" and "stuck" counts are how WIP problems show up before they're visible in velocity.

The per-person breakdown shows you each team member's current WIP count and their oldest item in days. If someone has 6 items in progress and their oldest has been running for 18 days, that's not a people problem. That's a coordination problem that management created by assigning too much at once, or by not having clear enough completion criteria.
GoalPath also shows this automatically during your alignment meeting. In the Flow Health & Escalation stage, if the team is over the WIP limit (calculated as teams × 2 for milestones, or collaborators × 1.7 for items), it surfaces a warning so the team can discuss it before continuing. That conversation replaces the ad-hoc "where are we on everything?" pings that would otherwise interrupt engineers mid-week.

## Velocity dashboard: what the data is actually telling you
The velocity page shows you per-team velocity charts alongside the flow metrics. It's designed to be read together, not separately.
If velocity is dropping week-over-week while Flow Load shows rising WIP, that's the Little's Law effect happening in your project. The team isn't getting slower, they're just drowning in context-switching. The fix isn't to work harder. It's to finish things before starting new ones.
If velocity looks steady but your Flow Time (lead time median) is climbing, you have items completing regularly but new items are spending more time waiting before they get touched. That's often a sign of too many parallel workstreams, where each team member is spread across multiple milestones and nothing gets undivided attention.
GoalPath applies a multitasking penalty to forecasts automatically. Across 2-3 milestones, effectiveness is 85% (15% penalty). Split across 4-7 milestones, it drops to 70% (30% penalty). At 8 or more milestones, it falls to 50% (50% penalty). This is not a punishment, it's math. When you see a forecast slip in GoalPath, check whether it's because of increased WIP rather than reduced capacity. Usually it is.
## The practical check
You don't need to wait for a sprint retrospective to see if WIP is a problem. You can check right now.
Open your items list. Count everything that's Started, Delivered, or Rejected but not yet Accepted. GoalPath counts all of these as work in progress. Divide by the number of people on the team. If the average is more than 2, you're running hot. If anyone has more than 3 active items, they're context-switching and probably not making meaningful progress on any of them.
Then look at the oldest started item. How many days has it been active? If the answer is more than two weeks and it hasn't shipped yet, that item is probably suffering from the "almost done" problem. There's a reason it hasn't finished, and that reason is usually related to something else that was started before it completed.
The fix isn't complicated. Stop starting. Start finishing.
The team picks the three most important in-progress items. Everything else gets paused, explicitly. No half-work. No "I'll keep making small progress on it." Paused means paused. Then you work until those three are done. After that, you start three more.
Most teams see lead times drop in the first two weeks of doing this. Not because anyone worked harder. Because context-switching stopped eating the hours.
## A note on velocity as a target
Velocity should not be a goal. If your team starts breaking items into smaller pieces to pump up the point count, your forecasts get worse, not better. If people mark things done before they're actually in users' hands, you lose the signal.
WIP counts are harder to game than velocity numbers. Either something is in progress or it isn't. Either it's been running for 20 days or it hasn't. That's why watching WIP aging gives you a more honest picture of team health than watching velocity points.
Velocity is how you forecast. WIP is how you manage. Both matter, but if you're only watching one, watch WIP.
---
Further reading
- Little's Law explained for software teams:
- Troy Magennis on WIP and cycle time:
- DORA 2024 report on software delivery performance:
- Daniel Vacanti's work on flow metrics and forecasting:
---
### When everything is Priority 1, teams default to the loudest work
*Published: 2026-03-14*
## Prioritisation is a leadership visibility problem
If you have worked in software for a while, especially in startups, you might have noticed that the priorities always seem to shift. Someone met a potential customer, and they really liked the idea of an automatic tax statement, next week we really need to have an integration to Google Workspace only to two weeks later have to onboard someone who is using Office 365.
The team just keeps on building, never sure that what they shipped last week still matters to anyone.
You could say that it's a lack of vision or a goal. But in reality, working with product development is about balancing multiple goals against each other, and this is often something that takes a lot of time and resources. A product manager or owner holds multiple meetings with both developers and sales and marketing, only to 3 weeks later hold the same meetings again. This time, with a different outcome.
Or the choice of the next feature to develop is dictated by the head of sales who "has a lead on the great next deal". The urgent Slack ping. The hallway ask. The VP who's most visible this week. Teams don't choose those things because people are lazy. They choose them because leadership hasn't made trade‑offs visible. When everything is Priority 1, the loudest stakeholder wins.
When planning is based on gut feel and emotions, the long term plan suffers. No product vision or big hairy audacious goal will help you, if you don't show how to take that vision to reality. Not with a perfect plan, but with a guiding strategy.
If prioritization is a leadership visibility problem, the solution isn't another spreadsheet. You need a visible, defensible system that turns stakeholder preference into a ranked agenda the team can trust.
## Why this matters
Unclear priorities create a feeling that you're not progressing, you are not achieving a goal. The every day can feel productive, and filled with wins. But if you zoom out and take a look at a 6-months span, you haven't actually made progress. Your product is basically the same, but with a few new additions. Longer feature development where features build on each other to compound business value becomes impossible. The idea of being able to do better and better each week, month, year loses validity and inevitably in this climate, it means you fall behind. Either you lose customers, or you lose talent frustrated that nothing changes.
## How to break the cycle
There are two strategies that I recommend to break this trend. To create structure, while still allowing people to come up with ideas and help align to a vision. Having a vision or big hairy audacious goal (BHAG) is great. But to achieve the goal you need to have a plan of how to get there. You might not follow the plan to the letter, there might be backup plans. But a roadmap to reach that goal is important.
### Reverse planning
In engineering and military planning there is a concept called reverse planning. Let's use a simple example, silly but simple. Let's say we're going to the moon.
If we want to reach the moon, we will need a moon lander, to get the moon lander to the moon, we will need a rocket, to launch the rocket we will need a launch pad.
The idea is that for each goal we see, we ask ourselves a single question "What do we need to get here?".
This is greatly simplified, but breaking the big hairy audacious goal down into smaller goals by asking the same question over and over again, is a great way to create a roadmap of what needs to be done to achieve the goal. Your great vision becomes that guiding star, the reverse planning process helps you ideate and develop the plan. It might even show you multiple ways to reach the goal.
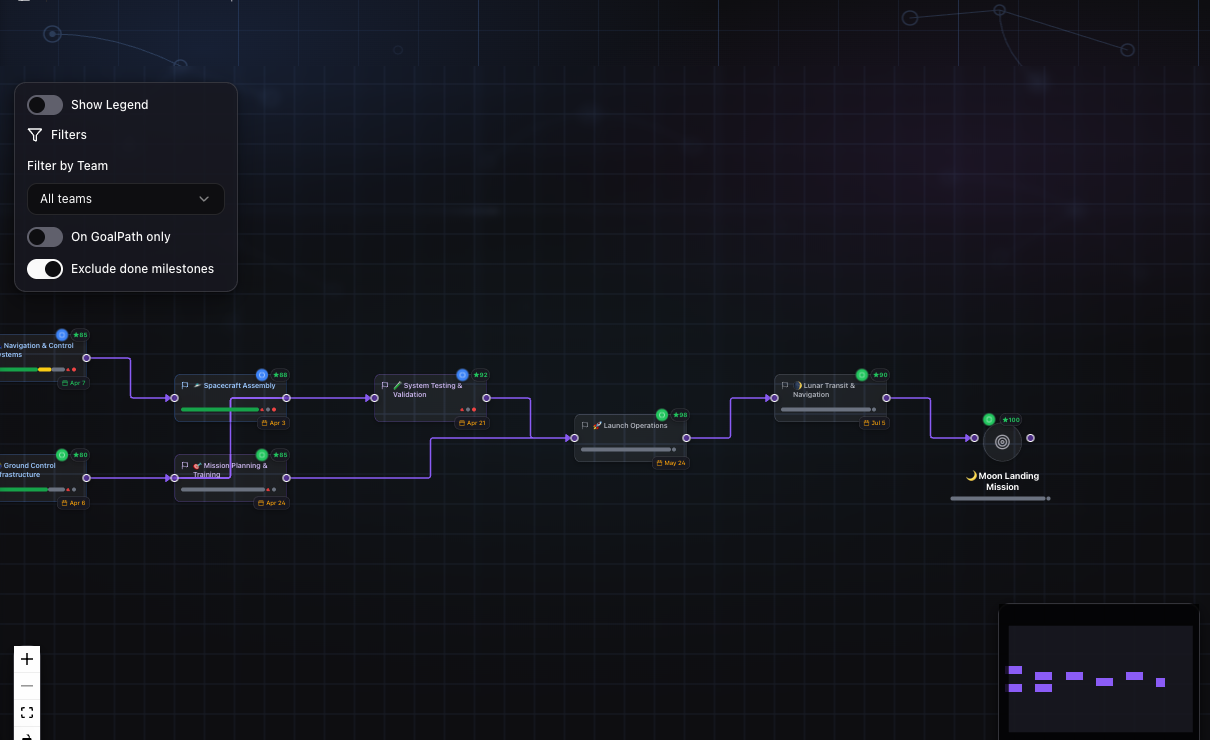
We do this in GoalPath, creating a visual roadmap, giving you options of how to reach the goal, or just shows the path there.
### Prioritising and choosing a path
Strategic thinking is not the default operating mode of most minds. Most people need to put their mind into planning or logic mode to assess if something is actually the right choice. A good way to do this is to have them vote. GoalPath supports multiple voting frameworks, you can even have your own. But what this does is that it forces you to take a step back and think about something from a few clarifying questions. If you create your own voting questions, you can have it align to your vision, further enforcing that we are trying to achieve a vision or goal. You can of course do this in Excel or any spreadsheet software if you wish, that's what I did before I made GoalPath.

For early stage startups or solo developers (yes, solo developers need structure too) a simple framework such as MoSCoW is a good starting point until you created a first version, or it's becoming harder and harder to choose between your options. If you work for a non-profit or have a specific and very clear vision, taking the time to create your own questions could be worth it. I recommend doing that in a workshop fashion with your stakeholders.
Having multiple people vote creates inclusion and draws on crowd intelligence, and inevitably helps make alignment and adoption easier.
GoalPath will take the votes and normalise the results to a business value score between 1-100. All of a sudden, you will be able to sort what you plan to do based on the value you think it will provide.
Meaning you can compare features to each other based on a strategic value instead of someone's eagerness or loudness.
Now if you sort them based on the business value, you will be able to quickly focus your prioritisation and planning efforts on the most valuable parts of your plan.
### Ordering becomes simple - but we still need to respect the plan
An ordered list is a great start to a backlog, but simply ordering on business value is not enough. A technical Product Manager might be able to respect dependencies, but it might not be enough. Some things just need to be in order. Coming back to the space program, we can't have a moon landing without a rocket to get us there.

Since we did the reverse planning in roadmap view, we captured the dependencies between the milestones we needed to reach to achieve our BHAG. GoalPath can now automatically create a rough backlog of which things to do in what order to reach the goal, using the dependencies and the business value as a guide. Again, creating a backlog for you to follow, and helping you focus on the most important next steps of the plan.
## Show the plan
Clearly showing everyone the plan, and making it accessible. Involving people in the design of it, allows the rest of the team to "make the right choice" because they know where we are going. It might not be 100% perfect, but without a framework, a vision and a structured plan to get there team members are robbed of the ability to make the right choice.
Having
- Business‑value voting collected from stakeholder preferences.
- A roadmap showing how we will reach a goal
- A structured backlog showing what order to execute things
Creates a combination that turns preferences into a defensible priority order and makes the decision visible where teams work.
The loudest voice stops being the de facto decider because the priority ranking and rationale live in the tool.
---
### Activity ≠ progress — too many things in flight is the #1 reason teams feel busy but don't deliver.
*Published: 2026-03-05*
# Activity ≠ progress: too many things in flight is the #1 reason teams feel busy but don't deliver
Your sprint ends Friday.
People look tired. Slack never stops. And when you ask “what shipped?” you get guesses, not dates.
Busy calendars. Lots of activity. Little delivered.
This is not a people problem. It’s a flow problem. Work spends most of its time waiting. If you fix the waiting, delivery follows. Here’s how to tell in 30 minutes, and what to run in the next two sprints.

## Diagnose in 30 minutes
Do these three quick checks. Each one has a single red flag. If any flag is red, you likely have too much in progress.
1. **Focus‑time sanity check (≈5 minutes)**
- Open two or three engineers’ calendars at random. Do they have at least one uninterrupted 3‑hour block per day (or ~3 hours total of long blocks)?
- If calendars are chopped into 30–60 minute meetings, context switching will eat the day. (See meeting benchmarks for engineers.)
- Red signal: no long uninterrupted blocks.
2. **WIP headcount (≈5 minutes)**
- Look at your board. Count items in Started/In‑Progress and divide by engineers.
- If the average is >1–2 active items per engineer, you’re likely multitasking too much. Little’s Law explains why more WIP increases lead time.
- Red signal: engineers juggling 3+ started items.
3. **Flow‑efficiency quick read (≈15 minutes)**
- Pick five recently delivered items. Compare active work time (hands‑on + review) to total lead time (created → delivered).
- Many teams sit at 15–25% flow efficiency, meaning 75–85% of lead time is waiting rather than active work (reviews, decisions, dependencies).
- Red signal: >70% waiting time.
If any check is red, adding heads or more meetings won’t help. You need to reduce things in flight and speed decisions.
## The short list of root causes
When teams look busy but don’t ship, the causes are predictable:
- Decision latency: approvals and unclear owners create queues.
- WIP overload: too many parallel items increases switching and review queues.
- Meeting fragmentation: frequent short meetings break flow.
- Tool or workflow mismatch: tooling amplifies work only when the flow is healthy.
- Unclear ownership and handoffs: items wait for the right person to notice them.
Fixes should target queues and wait time, not raw activity.
## Five fast experiments (1–2 sprints)
Pick two or three. Run them with an owner, a stop criterion, and one metric to watch.
1. **Protect focus blocks (1 sprint)**
- Reserve two 90‑minute deep‑work windows per developer per week.
- Replace one recurring sync with a 3‑line async update: Done / Next / Blocker.
- Watch: PR throughput, median lead time. Teams using protected focus see big gains in shipped features.
2. **One‑week WIP pilot → tune for 2 sprints**
- Limit in‑progress items to 1–2 per engineer. Finish before you start.
- Watch: median cycle time, throughput, defect rate. WIP limits commonly cut cycle time 20–40% in case studies.
3. **Meeting surgery (1 sprint)**
- Cancel low‑value recurring meetings. Try one or two no‑meeting days.
- Move status updates to a short async report.
- Watch: focus hours/week, developer satisfaction.
4. **Decision‑DOT (Decision Owner Table) (1–2 sprints)**
- List common decisions: what, owner, required inputs, SLA. Set a 24–48 hour SLA for non‑critical approvals.
- Watch: blocked time and SLA compliance.
5. **Baseline delivery metrics (30–90 days)**
- Track median & 85th‑percentile lead time, flow efficiency (rough), PR throughput, and percent unplanned work.
- Use these as your control before and after experiments.

## Don’t optimise flow blindly
- Some synchronous work is necessary (architecture, incidents). Don’t remove all meetings.
- Tune WIP limits experimentally; rigid limits can create artificial idle time or gaming.
- AI tools amplify output, but they amplify dysfunction if decision latency remains.
## 30 / 60 / 90 playbook for teams of 5–20 engineers
- 30 days: protect focus time; remove low‑value meetings; capture velocity baseline and unplanned work ratio.
- 60 days: apply WIP limits; introduce Decision‑DOTs; keep dashboards visible in cadences.
- 90 days: measure lead time improvements, scale successful practices across value streams.
## How GoalPath helps (practical, concrete)
GoalPath exists so you can run these experiments without extra process overhead and measure impact reliably.
- Automatic weekly progress reports: drafts of plain‑English updates are generated from actual execution data. Replace the Friday status email with a draft you review and send.
- Guided meetings: built‑in standup and alignment facilitators surface blockers, triage unplanned work, and capture decisions. No 50‑page wiki or outside facilitator required.
- WIP & triage affordances: Inbox, Unplanned badges and triage dialogs make scope creep visible the moment it happens.
- Velocity & forecasting: see velocity trends, probability bands and cascading forecasts so you can show stakeholders defensible dates and understand how WIP or a delayed dependency shifts the critical path.

Start small: create a project, run the two‑sprint experiment above, and let GoalPath generate the baseline reports for you. You should see your first automatic progress report within a week.
## Final note: a test you can run tomorrow
Run these three steps in your next two sprints: protect focus, cap WIP, prune meetings. Measure median lead time and PR throughput before and after. If you’re honest about the data, you’ll usually find the fastest way to ship more is to start fewer things.
Further reading
- FullScale summary of GitHub research on focus:
- Clockwise meeting benchmarks:
- TeachingAgile on WIP limits:
- Planview Flow Framework (flow metrics):
- DORA 2025 report:
- arXiv: Measuring AI impact on developer productivity (2025 study):
---
### Introducing Automated Weekly Updates: Your Team's Work, Translated for Leadership
*Published: 2025-01-15*
# Introducing Automated Weekly Updates
**Your Team's Work, Translated for Leadership. Automatically.**
We're announcing a feature that changes how teams communicate progress: **AI-powered weekly updates** that write themselves based on the work you're already doing in GoalPath.

No extra reporting. No status meetings. No manual writeups.
Just clear, consistent, trustworthy updates, every week, automatically.
## The Problem: Status Updates That Waste Everyone's Time
If you've ever spent an hour writing a status update, or sat through a meeting where someone reads through Jira tickets, you know the pain:
- **Teams spend hours** writing updates instead of building
- **Executives ask "what's actually happening?"** because status updates are vague or overly optimistic
- **Critical issues hide** in disconnected tools and Slack threads
- **Nothing is consistent** week to week: format changes, detail level varies
- **Onboarding new stakeholders** means digging through chat history or scheduling more meetings
The traditional solution? More meetings. More slides. More manual work.
We built a better way.
## How It Works: Work As You Normally Do
The key is that **you don't change how you work**.
### 1. Your Team Works in GoalPath
You're already creating and completing items, moving work through milestones, flagging blockers, and tracking dependencies. GoalPath captures all of this as it happens. No extra steps.
### 2. Weekly Summaries Generate Automatically
Every Sunday evening, GoalPath looks at each active milestone and creates a focused summary:
- **What was delivered** this week (with enough context so stakeholders understand the value)
- **Active blockers or concerns** (only if significant, no noise)
- **One actionable insight** for what to focus on next week
These summaries are grounded in real data: completed work items, activity history, unresolved highlights, current in-progress work, upcoming items, and past 4 weeks of context for pattern recognition.
If a milestone had no activity, the summary says so clearly. No fake updates, no spin.
### 3. Project Updates Aggregate Everything
All milestone summaries roll up into a single, coherent **project-level weekly update** structured for leadership:
**Overview**: What materially changed this week, current delivery outlook, and one focus item for leadership attention.
**Metrics**: Velocity, completion rates, active blockers, work in progress. Factual data, no interpretation.
**Milestone Progress**: A clear synthesis of each milestone's status: what moved forward, what's blocked, what changed since last week.
**Upcoming Milestones Forecast**: Data-driven delivery forecasts showing best case, expected, and risk-adjusted completion dates for in-progress and upcoming milestones. Grouped by team with active blockers highlighted.
**Looking Ahead**: What to watch next week, known dependencies, and any decisions that need to be made.
The whole update is **400-600 words**, concise enough for busy executives to scan in 2-3 minutes, detailed enough to actually understand what's happening.
### 4. You Stay in Control
**Critical point**: The AI drafts. You decide.
Every update is **fully editable** before it's shared. If the AI missed context, add it. If the tone isn't quite right, adjust it. If you want to emphasize something, do it.
All edits are tracked, so there's a clear record of what was AI-generated and what was human-refined.
## Why This Works: Evidence Over Opinion
Traditional status reporting has a trust problem: it's based on what people _say_ is happening, not what's _actually_ happening.
GoalPath's weekly updates are different:
| Traditional Status Reports | GoalPath Weekly Updates |
| -------------------------- | ------------------------------------ |
| Opinion-based | Evidence-based |
| Manually written | Automatically generated |
| Optimistic by default | Grounded in real data |
| Inconsistent week to week | Structurally consistent |
| Lost in Slack/email | Builds organizational memory |
| "Everything is green" | Honest about blockers |
| Delivery dates are guesses | 3-point forecasts from velocity data |
When leadership asks "what's happening with Project X?", they get a factual, consistent narrative with data-driven delivery forecasts, not political spin or someone's best guess.
## Real Benefits for Your Team
### For Individual Contributors
- **No status report homework**: your work speaks for itself
- **Credit for what you delivered**: completed items show up with context
- **Blockers get visibility**: highlights you flag reach leadership automatically
### For Team Leads and Project Managers
- **Reclaim 3-5 hours every week**: no more writing status decks or synthesizing Jira exports
- **Consistent communication**: same structure, same quality, every single week
- **Historical record**: see patterns over months. Are issues recurring? Is velocity trending?
### For Executives and Stakeholders
- **Clear signal over noise**: one concise update per project, per week
- **Data-driven forecasts**: see 3-point delivery estimates, not just "on track"
- **Earlier risk detection**: issues surface in writing before they become critical
- **No more status meetings**: read updates asynchronously, ask questions in context
- **Onboard new stakeholders instantly**: historical updates create perfect context
### For Everyone
- **Trust**: updates are evidence-based, not opinion-based
- **Time**: less time reporting, more time building
- **Clarity**: shared understanding of what's happening across the organization
## Multi-Language Support
GoalPath supports 8 languages with consistent, proper terminology:
- English
- Swedish
- Danish
- Norwegian
- German
- French
- Spanish
- Italian
Updates are generated in your project's language with proper terminology, not just translated, but written naturally from scratch.
## Holiday Awareness
The system knows when holidays might affect velocity (Christmas, Easter, New Year's, etc.) and provides this context in updates so stakeholders understand why activity might drop without raising false alarms.
## Getting Started
**For new projects**: Weekly updates are enabled by default. Just work as normal, and your first update will generate automatically on Sunday evening.
**For existing projects**: Navigate to your project settings and configure your preferred language and default recipients.
**Editing updates**: After generation, you'll see a draft in your project dashboard. Review it, make any edits, then click "Send" to share with stakeholders via email.
**Backfilling history**: Want to generate updates for past weeks? Use the "Generate Historical Updates" option in project settings to backfill up to 12 weeks of history.
## Why We Built This
We believe teams should spend time building, not reporting.
But we also believe leadership needs clarity to make good decisions.
The tension between these two needs has created an entire industry of status meetings, slide decks, and manual reporting work that everyone hates.
AI makes it possible to resolve this tension: **Automatic, trustworthy, evidence-based communication that requires zero extra work from teams.**
This is what "AI-assisted product management" should look like: invisible, helpful, and genuinely time-saving.
---
## Try It Today
Automated weekly updates are available now for all GoalPath users.
**New to GoalPath?** [Start your free trial](https://goalpath.app) and see your first weekly update generated automatically.
**Questions?** Email us at [support@goalpath.app](mailto:support@goalpath.app) or check out our [documentation](https://goalpath.app/docs).
---
### Understanding Velocity Metrics in GoalPath
*Published: 2024-11-15*
# Understanding Velocity Metrics
Velocity is the engine behind GoalPath's forecasting. It measures your team's actual delivery speed and uses that data to predict when future work will be done. No guessing required.
## What Is Velocity?
**Velocity** is how many story points your team completes per work-week (Monday through Friday). GoalPath calculates this automatically from completed work items.
```
Velocity = Story Points Completed / Work-Weeks
```
For example, if your team completes 45 story points over the last 6 weeks, your velocity is 7.5 points per work-week.
**Why work-weeks?** Calendar weeks include weekends, which would overestimate every forecast by nearly 29%. Work-weeks give you realistic timelines based on when work actually gets done.
## Why Velocity Matters
Velocity serves two purposes:
1. **Understand capacity**: How much work can your team realistically complete in a week?
2. **Forecast delivery**: When will a milestone finish based on current pace?
**Important**: Velocity is team-specific. Never compare velocity between teams, because different teams break down work differently. A team with velocity 20 isn't "better" than a team with velocity 10.
## How GoalPath Calculates Velocity
GoalPath looks at the **last 6 weeks** of completed items (items that reach "Accepted" status):
- Sums story points delivered each week
- Calculates the average velocity
- Tracks standard deviation to understand consistency
**Consistency matters.** A team that delivers 10 points every week is more predictable than one that swings between 5 and 15. GoalPath uses standard deviation to widen or tighten forecast ranges accordingly.

## What Makes GoalPath's Forecasts Different
Velocity alone gives you a baseline. GoalPath goes further with three additional factors:
### Multitasking Penalties
Context switching destroys productivity. When team members juggle multiple milestones simultaneously, GoalPath applies empirically-derived penalties:
- **1 concurrent milestone**: No penalty (100% effective)
- **2-3 milestones**: 15% penalty (85% effective)
- **4-7 milestones**: 30% penalty (70% effective)
- **8+ milestones**: 50% penalty (50% effective)
This prevents over-optimistic forecasts when your team is spread thin.
### Confidence Levels
Not all work is equally predictable. GoalPath supports three confidence levels per milestone:
- **High (90%)**: Well-understood work, clear requirements (10% buffer)
- **Medium (75%)**: Some unknowns, moderate complexity (25% buffer)
- **Low (60%)**: Exploratory work, many unknowns (50% buffer)
Lower confidence means wider forecast ranges, because honest uncertainty beats false precision.
### Uncertainty Propagation
GoalPath combines multiple uncertainty sources (unestimated items, velocity variance, confidence level, and team coordination) into a total uncertainty multiplier. This produces three scenarios:
- **Optimistic**: Everything goes better than expected
- **Expected**: Most likely outcome including reasonable buffers
- **Pessimistic**: Accounts for delays, blockers, and scope creep
The result is a forecast range, not a single date. Because the future is uncertain, and your forecasts should reflect that.

## Delivery Probability Lines
When viewing items in a milestone, colored lines appear between items showing delivery thresholds:
- **Green**: Best case, what you'll likely deliver at optimistic velocity
- **Amber**: Probable, based on median velocity
- **Red**: Worst case, at pessimistic velocity
These help you prioritize: anything above the green line for your target week is highly likely to ship. Items below the red line need reprioritization or scope reduction.
## Improving Your Forecasts
Want tighter ranges and faster delivery?
1. **Reduce multitasking**: Focus team members on fewer concurrent milestones
2. **Estimate all items**: Each unestimated item adds uncertainty
3. **Build consistent velocity**: Reduce WIP, address bottlenecks
4. **Increase confidence**: Spike on unknowns before committing
## Common Questions
### "Our velocity varies a lot. Is that normal?"
Yes. Real teams have natural variance. That's why GoalPath uses three-point estimation with uncertainty propagation instead of simple linear projections.
### "Should we try to increase velocity?"
Velocity is a **measuring tool**, not a target. Artificially inflating velocity (marking things done early, breaking items smaller) makes forecasts less accurate, not better.
### "What if we don't use story points?"
Progress reports work with item completion tracking. Forecasts are most accurate with story points, but GoalPath provides useful predictions based on execution order even without them.
## Next Steps
- [Understanding Project Forecasts](/docs/features/velocity-tracking): Deep dive into the math behind forecasts
- [Visual Roadmap](/docs/features/visual-roadmap): How dependencies and goal paths shape delivery
- [Automated Progress Reports](/docs/features/automated-weekly-updates): How velocity data powers weekly updates
Ready to see your velocity in action? View your project's forecast panel to see delivery dates based on your team's actual performance, not wishful thinking.
---
### Introducing GoalPath: Stop Writing Status Reports. Start Shipping.
*Published: 2024-10-25*
# Introducing GoalPath
Most teams don't fail due to lack of execution. They fail because stakeholders and teams talk past each other. Progress gets interpreted, not shared.
We built **GoalPath** to fix that.
## The Problem
Traditional project management tools are blank canvases. You set up Jira, then spend weeks documenting "how we use Jira" on Confluence. You build a roadmap in a spreadsheet, and it's outdated by Monday. You spend Friday afternoon writing the same status update you wrote last Friday.
Meanwhile, stakeholders keep asking "where are we?" because they don't trust the green dots on your dashboard.
**The real cost isn't the tool. It's the process tax around it.**
## A Different Approach
GoalPath embeds lean delivery expertise directly in the product. No separate documentation. No "how we work" wiki. No consultants.
### 1. Automatic Progress Reports
Every week, stakeholders get plain-English progress reports generated from your team's actual work:
- **What shipped**: completed items with context stakeholders can understand
- **What's blocked**: active blockers flagged automatically
- **Forecast changes**: "Launch moved 3 days, now Feb 14"
- **What needs attention**: risk-adjusted delivery dates with confidence ranges
**Time to create: 0 minutes.** Reports generate automatically every Sunday night, ready for Monday morning.
This isn't reporting. It's shared reality.
### 2. Data-Driven Forecasts
Instead of guessing "when will this be done?", GoalPath calculates it from your team's actual velocity:
- **3-point estimates**: Best case, expected, and risk-adjusted completion dates
- **Confidence-aware**: High, Medium, or Low confidence shapes uncertainty buffers
- **Multitasking penalties**: Accounts for the real cost of context switching
- **Dependency-aware**: Forecasts respect what's blocking what
Forecasts update automatically as work completes. No spreadsheet math. No guessing.

### 3. Process Built Into the Interface
GoalPath guides you through the right workflow: the interface shows you what to do next and why. Alignment meetings have built-in stages. The roadmap shows dependency flow toward goals. Prioritization uses proven frameworks (RICE, Impact/Effort, MoSCoW, or weighted scoring).
**Result:** No training docs. No process documentation. Just open GoalPath and follow the interface.
### 4. Roadmaps That Actually Navigate
Traditional roadmaps are wishful timelines. GoalPath roadmaps show the dependency flow toward business goals:
- **Reverse plan** from outcomes back to current work
- **See the critical path** and bottlenecks at a glance
- **Goal paths** highlight what you're committed to vs. what you're exploring
- **Forecasts update** as the roadmap evolves
Roadmaps become navigation tools, not decorative timelines.

## Who It's For
GoalPath is built for teams with 5-20 engineers, where everyone still knows each other but stakeholders are starting to ask "where are we?" multiple times per week.
- **Product Owners & PMs** spending hours on status updates
- **Tech Leads & CTOs** who want stakeholder visibility without interrupting their team
- **Founders** who realize spreadsheets won't scale past 5 engineers
## Getting Started
1. **Create Your Project**: set up your first project and invite your team
2. **Add Milestones**: define key deliverables and connect dependencies
3. **Track Velocity**: complete work items to build your baseline
4. **Review Forecasts**: see realistic delivery dates with confidence ranges
GoalPath works best with at least 2-3 weeks of velocity data. The more historical data you have, the tighter your forecast ranges become.
## The Bottom Line
**Replace 3-5 hours of status meetings per week** with one automated update that takes 0 minutes to create. Your team ships. Your stakeholders stay informed. Zero meetings required.
[Get started with GoalPath today →](https://goalpath.app)
---