Activity ≠ progress — too many things in flight is the #1 reason teams feel busy but don't deliver.
Activity ≠ progress: too many things in flight is the #1 reason teams feel busy but don't deliver
Your sprint ends Friday. People look tired. Slack never stops. And when you ask “what shipped?” you get guesses, not dates.
Busy calendars. Lots of activity. Little delivered.
This is not a people problem. It’s a flow problem. Work spends most of its time waiting. If you fix the waiting, delivery follows. Here’s how to tell in 30 minutes, and what to run in the next two sprints.

Diagnose in 30 minutes
Do these three quick checks. Each one has a single red flag. If any flag is red, you likely have too much in progress.
-
Focus‑time sanity check (≈5 minutes)
- Open two or three engineers’ calendars at random. Do they have at least one uninterrupted 3‑hour block per day (or ~3 hours total of long blocks)?
- If calendars are chopped into 30–60 minute meetings, context switching will eat the day. (See meeting benchmarks for engineers.)
- Red signal: no long uninterrupted blocks.
-
WIP headcount (≈5 minutes)
- Look at your board. Count items in Started/In‑Progress and divide by engineers.
- If the average is >1–2 active items per engineer, you’re likely multitasking too much. Little’s Law explains why more WIP increases lead time.
- Red signal: engineers juggling 3+ started items.
-
Flow‑efficiency quick read (≈15 minutes)
- Pick five recently delivered items. Compare active work time (hands‑on + review) to total lead time (created → delivered).
- Many teams sit at 15–25% flow efficiency, meaning 75–85% of lead time is waiting rather than active work (reviews, decisions, dependencies).
- Red signal: >70% waiting time.
If any check is red, adding heads or more meetings won’t help. You need to reduce things in flight and speed decisions.
The short list of root causes
When teams look busy but don’t ship, the causes are predictable:
- Decision latency: approvals and unclear owners create queues.
- WIP overload: too many parallel items increases switching and review queues.
- Meeting fragmentation: frequent short meetings break flow.
- Tool or workflow mismatch: tooling amplifies work only when the flow is healthy.
- Unclear ownership and handoffs: items wait for the right person to notice them.
Fixes should target queues and wait time, not raw activity.
Five fast experiments (1–2 sprints)
Pick two or three. Run them with an owner, a stop criterion, and one metric to watch.
-
Protect focus blocks (1 sprint)
- Reserve two 90‑minute deep‑work windows per developer per week.
- Replace one recurring sync with a 3‑line async update: Done / Next / Blocker.
- Watch: PR throughput, median lead time. Teams using protected focus see big gains in shipped features.
-
One‑week WIP pilot → tune for 2 sprints
- Limit in‑progress items to 1–2 per engineer. Finish before you start.
- Watch: median cycle time, throughput, defect rate. WIP limits commonly cut cycle time 20–40% in case studies.
-
Meeting surgery (1 sprint)
- Cancel low‑value recurring meetings. Try one or two no‑meeting days.
- Move status updates to a short async report.
- Watch: focus hours/week, developer satisfaction.
-
Decision‑DOT (Decision Owner Table) (1–2 sprints)
- List common decisions: what, owner, required inputs, SLA. Set a 24–48 hour SLA for non‑critical approvals.
- Watch: blocked time and SLA compliance.
-
Baseline delivery metrics (30–90 days)
- Track median & 85th‑percentile lead time, flow efficiency (rough), PR throughput, and percent unplanned work.
- Use these as your control before and after experiments.

Don’t optimise flow blindly
- Some synchronous work is necessary (architecture, incidents). Don’t remove all meetings.
- Tune WIP limits experimentally; rigid limits can create artificial idle time or gaming.
- AI tools amplify output, but they amplify dysfunction if decision latency remains.
30 / 60 / 90 playbook for teams of 5–20 engineers
- 30 days: protect focus time; remove low‑value meetings; capture velocity baseline and unplanned work ratio.
- 60 days: apply WIP limits; introduce Decision‑DOTs; keep dashboards visible in cadences.
- 90 days: measure lead time improvements, scale successful practices across value streams.
How GoalPath helps (practical, concrete)
GoalPath exists so you can run these experiments without extra process overhead and measure impact reliably.
- Automatic weekly progress reports: drafts of plain‑English updates are generated from actual execution data. Replace the Friday status email with a draft you review and send.
- Guided meetings: built‑in standup and alignment facilitators surface blockers, triage unplanned work, and capture decisions. No 50‑page wiki or outside facilitator required.
- WIP & triage affordances: Inbox, Unplanned badges and triage dialogs make scope creep visible the moment it happens.
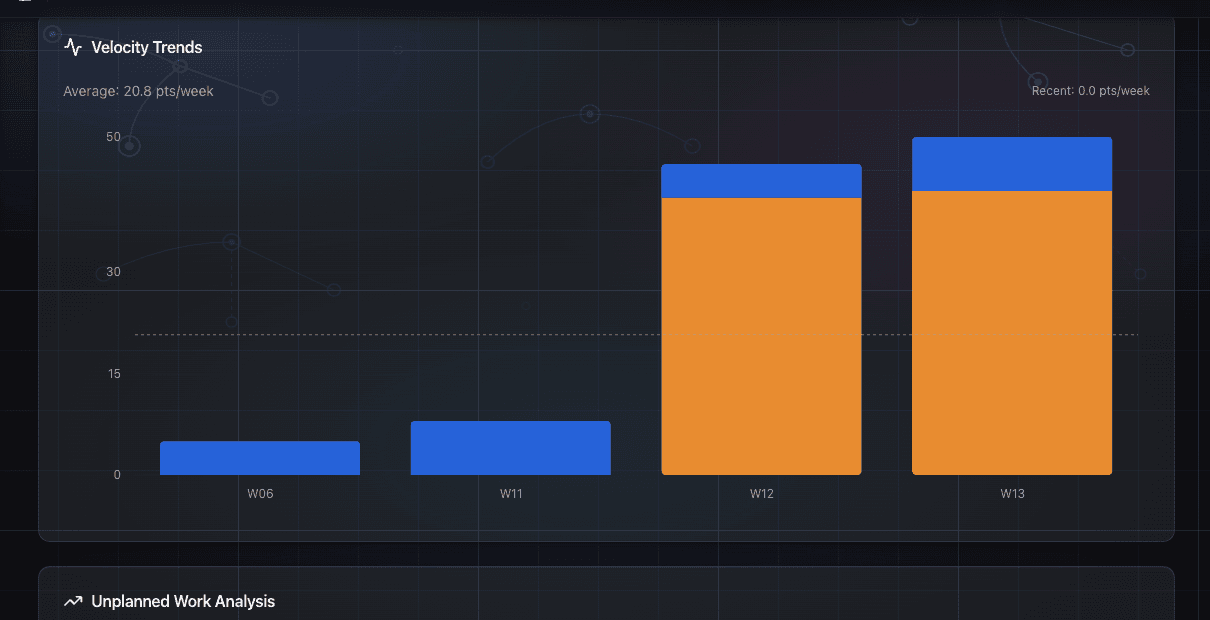
- Velocity & forecasting: see velocity trends, probability bands and cascading forecasts so you can show stakeholders defensible dates and understand how WIP or a delayed dependency shifts the critical path.

Start small: create a project, run the two‑sprint experiment above, and let GoalPath generate the baseline reports for you. You should see your first automatic progress report within a week.
Final note: a test you can run tomorrow
Run these three steps in your next two sprints: protect focus, cap WIP, prune meetings. Measure median lead time and PR throughput before and after. If you’re honest about the data, you’ll usually find the fastest way to ship more is to start fewer things.
Further reading
- FullScale summary of GitHub research on focus: https://fullscale.io/blog/engineering-productivity-paradox/
- Clockwise meeting benchmarks: https://www.getclockwise.com/eng-meeting-benchmarks
- TeachingAgile on WIP limits: https://teachingagile.com/kanban/introduction/kanban-wip-limits
- Planview Flow Framework (flow metrics): https://info.planview.com/rs/456-QCH-520/images/flow-metrics-business-leader-guide_ebook_rbd.pdf
- DORA 2025 report: https://dora.dev/research/2025/dora-report/
- arXiv: Measuring AI impact on developer productivity (2025 study): https://arxiv.org/html/2509.19708v1
Ready to plan your roadmap with data?
Create an account on GoalPath and start tracking velocity, forecasting milestones, and delivering predictably.
Create an Account