Understanding Velocity Metrics in GoalPath
Understanding Velocity Metrics
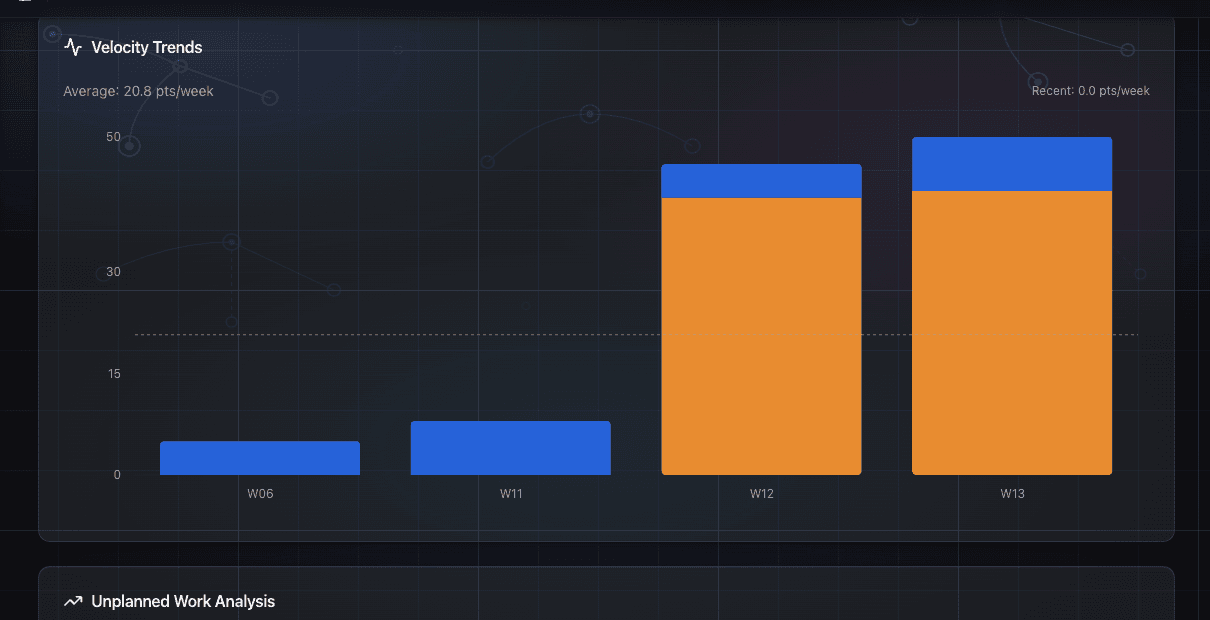
Velocity is the engine behind GoalPath's forecasting. It measures your team's actual delivery speed and uses that data to predict when future work will be done. No guessing required.
What Is Velocity?
Velocity is how many story points your team completes per work-week (Monday through Friday). GoalPath calculates this automatically from completed work items.
Velocity = Story Points Completed / Work-WeeksFor example, if your team completes 45 story points over the last 6 weeks, your velocity is 7.5 points per work-week.
Why work-weeks? Calendar weeks include weekends, which would overestimate every forecast by nearly 29%. Work-weeks give you realistic timelines based on when work actually gets done.
Why Velocity Matters
Velocity serves two purposes:
- Understand capacity: How much work can your team realistically complete in a week?
- Forecast delivery: When will a milestone finish based on current pace?
How GoalPath Calculates Velocity
GoalPath looks at the last 6 weeks of completed items (items that reach "Accepted" status):
- Sums story points delivered each week
- Calculates the average velocity
- Tracks standard deviation to understand consistency
Consistency matters. A team that delivers 10 points every week is more predictable than one that swings between 5 and 15. GoalPath uses standard deviation to widen or tighten forecast ranges accordingly.

What Makes GoalPath's Forecasts Different
Velocity alone gives you a baseline. GoalPath goes further with three additional factors:
Multitasking Penalties
Context switching destroys productivity. When team members juggle multiple milestones simultaneously, GoalPath applies empirically-derived penalties:
- 1 concurrent milestone: No penalty (100% effective)
- 2-3 milestones: 15% penalty (85% effective)
- 4-7 milestones: 30% penalty (70% effective)
- 8+ milestones: 50% penalty (50% effective)
This prevents over-optimistic forecasts when your team is spread thin.
Confidence Levels
Not all work is equally predictable. GoalPath supports three confidence levels per milestone:
- High (90%): Well-understood work, clear requirements (10% buffer)
- Medium (75%): Some unknowns, moderate complexity (25% buffer)
- Low (60%): Exploratory work, many unknowns (50% buffer)
Lower confidence means wider forecast ranges, because honest uncertainty beats false precision.
Uncertainty Propagation
GoalPath combines multiple uncertainty sources (unestimated items, velocity variance, confidence level, and team coordination) into a total uncertainty multiplier. This produces three scenarios:
- Optimistic: Everything goes better than expected
- Expected: Most likely outcome including reasonable buffers
- Pessimistic: Accounts for delays, blockers, and scope creep
The result is a forecast range, not a single date. Because the future is uncertain, and your forecasts should reflect that.

Delivery Probability Lines
When viewing items in a milestone, colored lines appear between items showing delivery thresholds:
- Green: Best case, what you'll likely deliver at optimistic velocity
- Amber: Probable, based on median velocity
- Red: Worst case, at pessimistic velocity
These help you prioritize: anything above the green line for your target week is highly likely to ship. Items below the red line need reprioritization or scope reduction.
Improving Your Forecasts
Want tighter ranges and faster delivery?
- Reduce multitasking: Focus team members on fewer concurrent milestones
- Estimate all items: Each unestimated item adds uncertainty
- Build consistent velocity: Reduce WIP, address bottlenecks
- Increase confidence: Spike on unknowns before committing
Common Questions
"Our velocity varies a lot. Is that normal?"
Yes. Real teams have natural variance. That's why GoalPath uses three-point estimation with uncertainty propagation instead of simple linear projections.
"Should we try to increase velocity?"
Velocity is a measuring tool, not a target. Artificially inflating velocity (marking things done early, breaking items smaller) makes forecasts less accurate, not better.
"What if we don't use story points?"
Progress reports work with item completion tracking. Forecasts are most accurate with story points, but GoalPath provides useful predictions based on execution order even without them.
Next Steps
- Understanding Project Forecasts: Deep dive into the math behind forecasts
- Visual Roadmap: How dependencies and goal paths shape delivery
- Automated Progress Reports: How velocity data powers weekly updates
Ready to plan your roadmap with data?
Create an account on GoalPath and start tracking velocity, forecasting milestones, and delivering predictably.
Create an Account