Why WIP limits matter more than velocity
Your team finishes a two-week sprint. Velocity looks fine, maybe even good. But when you ask which features actually shipped to customers, there's an awkward pause. A bunch of things are 80% done. A couple more are waiting for review. One has been "almost ready" for three weeks.
The velocity number told you nothing useful about this. It never does, until after the fact.
What velocity actually measures
Velocity tells you how much work your team completed over some past window of time. It's useful for forecasting. It's not useful for telling you whether your team is going to have a good week, or a bad one, before it happens.
Velocity tells you how far you drove last week. WIP tells you how many cars are on the road right now. One is history, the other is a prediction of what happens next.
When your WIP is high and climbing, velocity will eventually show you the damage. But by then, you've already spent a few weeks in trouble. That's why WIP is a leading indicator and velocity is a lagging one.
Little's Law, explained without the textbook
There's a formula called Little's Law that comes from queuing theory. You don't need the math. The principle is this:
Lead time = WIP divided by throughput.
If your team completes 5 items per week and has 5 things in progress, the average lead time is 1 week. If that same team starts 20 things at once while still completing 5 per week, average lead time jumps to 4 weeks. Same team. Same throughput. Four times longer to get anything done.
That's not theory. That's what happens in most teams. Items get started because they seem urgent. Nobody explicitly decides to have 20 things in progress. It just accumulates. And every item added to the pile makes every other item slower.
The counterintuitive part: finishing one thing and starting nothing new is faster, for the team's overall output, than starting two new things and having three things "almost done."
Why "almost done" is almost worthless
There's a useful question to ask about any item that's been in progress for more than a week: what's the actual customer value of 80% done?
Usually the answer is zero. A feature that's deployed and in users' hands is worth something. A feature that's still in a branch, or waiting for a final review, or needs one more thing before it can ship, is not generating any value yet. It's inventory.
The longer things sit in "almost done" status, the more they accumulate risk too. Code that's been sitting in review for two weeks while other work has been merged is going to have conflicts. The person who wrote it has moved on mentally. The context is gone.
High WIP is how "almost done" becomes "actually never done." Things get superseded, de-prioritized, forgotten. The team was busy the whole time.
The pattern that accelerates the problem
Without WIP discipline, the spiral goes like this.
Team has 10 things in progress. Nothing is finishing because everyone is switching contexts. A stakeholder gets impatient about feature X, which has been in progress for two weeks. Team lead adds feature X to the standup agenda. Someone else notices feature Y is also delayed. Both get attention. Two more things get started to unblock them. Now there are 14 things in progress.
At the next sprint review, velocity looks okay because the team did complete some things. But lead times are getting longer. The stakeholder still doesn't have feature X. There's another alignment meeting to "figure out what's going on."
That alignment meeting is the replaced ritual. Teams do this regularly: a Monday sync, a mid-sprint check-in, a "what's blocking us?" call. The intent is to surface problems. The problem is, by the time it surfaces in a meeting, you've already been slow for two weeks.
You need to see it while it's happening, not after.
What GoalPath's Flow Load view shows you
GoalPath tracks WIP at two levels: milestone WIP (how many milestones are currently in progress) and item WIP (how many items are in progress). Both are visible in the Flow Load section of the Velocity Analytics page, with a per-person breakdown available in the Flow Load card.
The Flow Load card shows you total WIP right now and breaks it into aging buckets: fresh (0-3 days), normal (4-7 days), aging (8-14 days), stale (15-30 days), and stuck (over 30 days). That last bucket is the number to watch. A few "fresh" items is expected. Growing "stale" and "stuck" counts are how WIP problems show up before they're visible in velocity.

The per-person breakdown shows you each team member's current WIP count and their oldest item in days. If someone has 6 items in progress and their oldest has been running for 18 days, that's not a people problem. That's a coordination problem that management created by assigning too much at once, or by not having clear enough completion criteria.
GoalPath also shows this automatically during your alignment meeting. In the Flow Health & Escalation stage, if the team is over the WIP limit (calculated as teams × 2 for milestones, or collaborators × 1.7 for items), it surfaces a warning so the team can discuss it before continuing. That conversation replaces the ad-hoc "where are we on everything?" pings that would otherwise interrupt engineers mid-week.

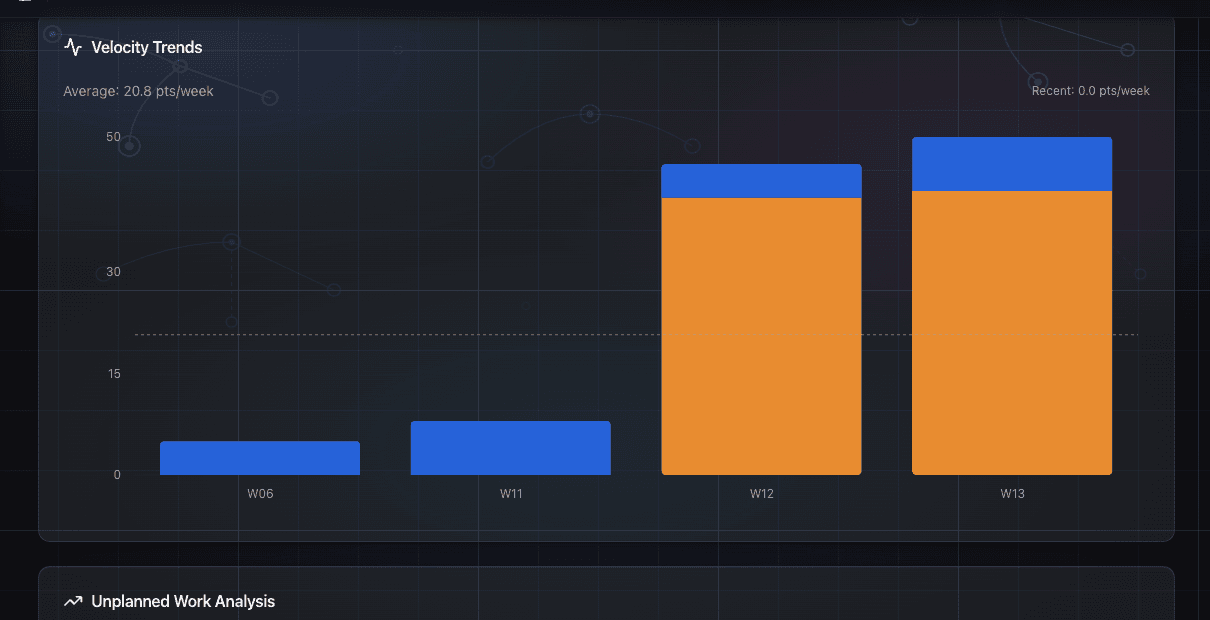
Velocity dashboard: what the data is actually telling you
The velocity page shows you per-team velocity charts alongside the flow metrics. It's designed to be read together, not separately.
If velocity is dropping week-over-week while Flow Load shows rising WIP, that's the Little's Law effect happening in your project. The team isn't getting slower, they're just drowning in context-switching. The fix isn't to work harder. It's to finish things before starting new ones.
If velocity looks steady but your Flow Time (lead time median) is climbing, you have items completing regularly but new items are spending more time waiting before they get touched. That's often a sign of too many parallel workstreams, where each team member is spread across multiple milestones and nothing gets undivided attention.
GoalPath applies a multitasking penalty to forecasts automatically. Across 2-3 milestones, effectiveness is 85% (15% penalty). Split across 4-7 milestones, it drops to 70% (30% penalty). At 8 or more milestones, it falls to 50% (50% penalty). This is not a punishment, it's math. When you see a forecast slip in GoalPath, check whether it's because of increased WIP rather than reduced capacity. Usually it is.
The practical check
You don't need to wait for a sprint retrospective to see if WIP is a problem. You can check right now.
Open your items list. Count everything that's Started, Delivered, or Rejected but not yet Accepted. GoalPath counts all of these as work in progress. Divide by the number of people on the team. If the average is more than 2, you're running hot. If anyone has more than 3 active items, they're context-switching and probably not making meaningful progress on any of them.
Then look at the oldest started item. How many days has it been active? If the answer is more than two weeks and it hasn't shipped yet, that item is probably suffering from the "almost done" problem. There's a reason it hasn't finished, and that reason is usually related to something else that was started before it completed.
The fix isn't complicated. Stop starting. Start finishing.
The team picks the three most important in-progress items. Everything else gets paused, explicitly. No half-work. No "I'll keep making small progress on it." Paused means paused. Then you work until those three are done. After that, you start three more.
Most teams see lead times drop in the first two weeks of doing this. Not because anyone worked harder. Because context-switching stopped eating the hours.
A note on velocity as a target
Velocity should not be a goal. If your team starts breaking items into smaller pieces to pump up the point count, your forecasts get worse, not better. If people mark things done before they're actually in users' hands, you lose the signal.
WIP counts are harder to game than velocity numbers. Either something is in progress or it isn't. Either it's been running for 20 days or it hasn't. That's why watching WIP aging gives you a more honest picture of team health than watching velocity points.
Velocity is how you forecast. WIP is how you manage. Both matter, but if you're only watching one, watch WIP.
Further reading
- Little's Law explained for software teams: https://leankit.com/learn/kanban/littles-law/
- Troy Magennis on WIP and cycle time: https://focusedobjective.com/free-tools-and-research/
- DORA 2024 report on software delivery performance: https://dora.dev/research/2024/dora-report/
- Daniel Vacanti's work on flow metrics and forecasting: https://actionableagile.com/resources/
Ready to plan your roadmap with data?
Create an account on GoalPath and start tracking velocity, forecasting milestones, and delivering predictably.
Create an Account